The Color of Inequality Part 2: Race, Place, and Crime
By: Mike Shields & Mohona Siddique
Date: June 4, 2020
AUTHORS' NOTE:
As the country was buckling under the weight of the COVID-19 pandemic, the widely broadcast killing of an unarmed Black man, George Floyd, by a white Minneapolis police officer along with Amy Cooper's threatening use of police force to confront Christian Cooper in Central Park added to a litany of events that precipitated renewed protests against police brutality across the nation. While some protests remained peaceful, like those in Camden, New Jersey, peaceful protests in Philadelphia incited civil unrest and resulted in violent confrontations. It is not the first time that communities in Philadelphia have protested against racial injustice and police brutality, and the events of recent weeks are not isolated. Rather, they exist within the historical context of the intersection of race and economic opportunity – and for Black Americans and many other communities of color in the U.S, economic opportunity and mobility still remain out of reach.
To provide context and data to inform ongoing conversations about structural racism and illustrate how these enduring inequalities have shaped present-day neighborhood and civic relations in Philadelphia, the Economy League of Greater Philadelphia is launching a special Leading Indicator series called The Color of Inequality. The series will highlight measures of racial and ethnic inequality in the City of Philadelphia to contribute to ongoing conversations about racism and prejudice.
The Color of Inequality Part 2: Race, Place, and Crime
From the days of Frank Rizzo’s controversial tenure as Philadelphia Police Commissioner from 1968-1971 to the notorious 1985 MOVE bombing by Philadelphia police to contemporary City Council debates on defunding the police department, the relationship between Black Philadelphians and the criminal justice system has long been complex and fraught. One pattern remains relatively consistent: arrests, incarceration, and the collateral consequences of the criminal justice system are both geographically and racially predictable. In this week’s installment of the Color of Inequality, we focus on how “race and place” matter in the context of criminal justice and explore some of the dynamics around criminal justice policy that manifest themselves in present-day Philadelphia.

Concentrated Poverty in Urban Neighborhoods
In the U.S, poverty is highly correlated with race and ethnicity. Racially-biased housing and development policies spatially relegated communities of color to marginalized inner-city neighborhoods that continue to suffer from financial, occupational, and residential redlining, further concentrating poverty in these areas. Black and Latinx populations in the U.S. had poverty rates of 24 and 21 percent respectively (far outpacing the national poverty rate of 14 percent) [1].
Concentrations of poverty also correlate with elevated levels of crime. Across all racial and ethnic groups, persons living in poorer households see higher rates of victimization and violence because of the scarcity of social and financial resources [2]. Thus, the concentration of poverty for many communities of color in the U.S. has been a systematic disadvantage that has also subjected them to higher rates of crime and victimization when compared to wealthier white neighborhoods.
While sophisticated analyses of the geography of violent crime have shown that violent crime in particular is the result of very small numbers of “street groups” in highly concentrated areas, refuting the notion that there are in fact “violent neighborhoods,” law enforcement practices still largely target entire neighborhoods - most often through a racialized lens. This leads to what some criminologists have called “over-enforcement and under-protection,” leading to a severe erosion of trust in institutions such as law enforcement. Since concentrated poverty is highly correlated with elevated levels of crime, and since being “tough on crime” has become a mantra for modern politicians, “urban” crime is inextricably bound up with race - and therefore with racism [3].

Racism in the U.S. Criminal Justice System
The U.S. criminal justice system has been built with both explicit and implicit biases towards people of color. Many of the modern procedures and laws were designed during the historical Jim Crow era [4]. The professionalization of police forces as nonpolitical public servants and the standard practices associated with arrests and trials were developed during a time of normalized racial inequality. In addition to this legacy, more modern campaigns and practices like the War on Drugs, the “Broken Windows” Theory, or Stop-and-Frisk have served to only deepen a mutual distrust between communities of color and law enforcement agents. Structural racism is deeply embedded in all facets of the criminal justice system and affects how both criminal and noncriminal activities are monitored, processed, and adjudicated, particularly in Black- and Brown-majority neighborhoods. Some examples include:
- Police forces are known to allocate more resources and officers to nonwhite neighborhoods where crime rates are significantly higher [5], but this produces a lingering question of causality: are crime rates higher because more police are monitoring and reporting all activity within the neighborhood?
- Many trial and sentencing procedures and practices, like cash bail, are written to be “colorblind” but only exacerbate racial and ethnic inequalities since it is difficult for a low-income suspect to post bail. Thus, more Black and Latinx suspects are detained prior to trial than Non-Hispanic White offenders – which also tends to bias sentencing [6].
As a result, though Black and Latinx individuals account for only 12 and 18 percent of the total U.S. population respectively, they make up 33 and 23 percent of sentenced prisoners under state or federal jurisdiction in 2018. Non-Hispanic Whites account for 61 percent of the total U.S. population and only 31 percent of sentenced prisoners under state or federal jurisdiction in 2018 [1,7].

The War on Drugs
With Richard Nixon’s declaration of drug abuse as “public enemy number one” in 1971, the War on Drugs became a highly funded, decades-long law enforcement campaign to end the illegal drug trade in the United States [8]. One of the most pernicious aspects of the War on Drugs was its double-standard of punishment for communities of color. New laws allowed for the severe punishment of “street drugs” predominantly seen in inner-city neighborhoods while there was minimal sentencing or surveillance for more expensive “designer drugs” more often used by Non-Hispanic Whites. For example, the possession of crack cocaine received greater sentencing than the possession of higher quantities of the more potent powdered form of the drug [9]. The War on Drugs also introduced a series of “colorblind” laws that disproportionately affected communities of color. The creation of Drug-Free School Zones, for example, led to increased penalties and sentencing for possession of drugs within these geographic areas around local schools; these zones disproportionately affect communities of color in dense urban neighborhoods versus sprawling white suburban counterparts [6].

Collateral Consequences
Individuals who encounter the criminal justice system are often tethered to their criminal records for life. Both individuals with criminal records and their families are subject to a host of formal and informal barriers, “collateral consequences” that expand the scope of punishment well beyond the criminal justice system. These include the emotional well-being and academic performance of the children of the incarcerated, an individual’s ability to find employment or obtain housing, and even the overall economic outcomes of a community. These consequences in turn impact economic mobility, creating an inextricable link between race and socioeconomic status. Here are some resources related to the collateral consequences of incarceration:
The Leading Indicator - Arrests in Philadelphia
Figure 1 shows a simplified spatial relationship between arrests and communities of color in Philadelphia from 2014 to 2019. Using arrest reports curated by the District Attorney’s Office of Philadelphia and demographic data from the U.S. Census, the two interactive maps compare the total number of arrests recorded in each census tract per year with each tract’s racial or ethnic residential majority, the population count, the estimated poverty rate, and the median household income.
FIGURE 1
NOTE: Data were obtained from the District Attorney's Office of Philadelphia and five-year estimates of the 2018 American Community Survey maintained and curated by the U.S. Census Bureau. Tracts were excluded from demographic measures if the population count was less than 400 residents and/or the group quarter population exceeded a third of the tract’s total population.
Though available data do not allow us to determine whether the arrests mapped in Figure 1 are attributable to residents of a particular census tract, the map shows that neighborhoods of color see a disproportionate number of arrests when compared to majority Non-Hispanic White tracts. Exceptions to this trend are the tracts surrounding City Hall, University City, and one tract that encompasses a large portion of the Kensington neighborhood. The high number of arrests in these tracts reflect their functions as major hubs for congregation and travel - except Kensington where the ongoing opioid crisis may be implicated. There is a growing literature on the way police tactics and 911 calls serve as a form of social control against Black and Brown populations in major gathering centers like train stations, landmarks, parks, and other public amenities. The map in Figure 1 also details the interrelationship between crime and poverty; tracts with lower median household incomes and a higher percentage of the population living below the federal poverty threshold also witness a higher number of arrests.
Figure 2 aggregates the average number of arrests by each census tract’s racial or ethnic majority residential population. As with Figure 1, the data do not allow us to attribute arrests to residents of the census tract but they represent arrests that result from an incident that occurred within the tract. Figure 2 also illustrates how Philadelphia’s communities of color bear the burden of arrests far more than Non-Hispanic White communities. Majority-Latinx tracts outpace all other tracts with an average of 414 arrests per tract per year between 2014 and 2019; this is more than four times greater than the city’s average and 9.6 times more arrests than those in majority-White tracts. The average number of annual arrests per tract among majority-Black and majority-Asian census tracts more closely resembles the city’s average but are over two times greater than majority-White tracts. Each tract’s average poverty rate also correlates highly with the average number of arrests.
FIGURE 2
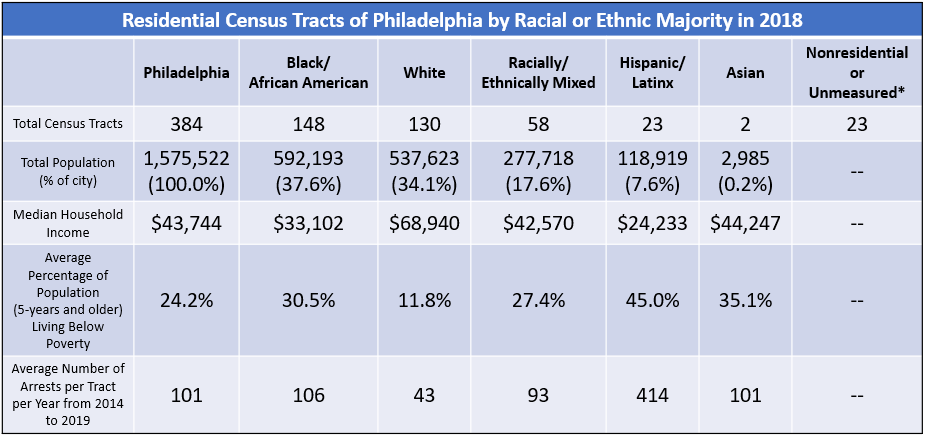
NOTE: Data were obtained from the District Attorney's Office of Philadelphia and five-year estimates of the 2018 American Community Survey maintained and curated by the U.S. Census Bureau.
* Nonresidential or Unmeasured tracts includes tracts whose population count was less than 400 residents and/or the group quarter population exceeded a third of the tract’s total population.
It is important to remember that the simple relationship shown here between race, place, and crime does not constitute evidence of “dangerous” neighborhoods. In fact, numerous studies have found that most criminal activity in a city tends to concentrate among small social networks which account for tiny percentages of the population. What the data do suggest, however, is the ways structural racism has concentrated poverty and crime within urban neighborhoods predominantly composed of people of color. Evidence suggests that strategies to tackle concentrated poverty in these neighborhoods may be a better solution than continued surveillance and aggressive enforcement by police. As the city comes to terms with structural inequalities and racism baked into its criminal justice system, it may want to look to the deeper and more intentional workforce development programs and pardon reform initiatives as part of its toolkit for addressing the economic hardships of these neighborhoods.
Read More
Works Cited
1] U.S. Census Bureau. 2019. 2014-2018 American Community Survey 5-Year Estimates. Retrieved from: (https://www.census.gov/data.html).
[2] Harrell, Erika, Lynn Langton, Marcus Berzofsky, Lance Couzens, & Hope Smiley-McDonald. 2014. Household Poverty and Nonfatal Violent Victimization, 2008–2012. NCJ248384. Washington D.C: U.S. Department of Justice. Retrieved from: (https://www.bjs.gov/index.cfm?ty=pbdetail&iid=5137).
[3] Alexander, Michelle. 2010. The New Jim Crow: Mass Incarceration in the Age of Colorblindness. New York City, NY: The New Press.
[4] Klarman, Michael J. 2000. “The Racial Origins of Modern Criminal Procedure.” Michigan Law Review, Fall. Retrieved from: (https://papers.ssrn.com/sol3/papers.cfm?abstract_id=206428).
[5] La Vigne, Nancy, Jocelyn Fontaine, & Anamika Dwivedi. 2017. How Do People in High-Crime, Low-Income Communities View the Police? The Urban Institute, February. Retrieved from: (https://www.urban.org/sites/default/files/publication/88476/how_do_peop…).
[6] The Sentencing Project. 2018. Report of The Sentencing Project to the United Nations Special Rapporteur on Contemporary Forms of Racism, Racial Discrimination, Xenophobia, and Related Intolerance: Regarding Racial Disparities in the United States Criminal Justice System. Washington D.C. Retrieved from: (file:///C:/Users/MichaelShields/Downloads/UN-Report-on-Racial-Disparities.pdf).
[7] Bureau of Justice Statistics. 2020. Prisoners in 2018. NCJ 253516. Washington D.C: U.S. Department of Justice. Retrieved from: (https://www.bjs.gov/index.cfm?ty=pbdetail&iid=6846).
[8] Friedersdorf, Conor. 2011. “The War on Drugs Turns 40.” The Atlantic, June 15. Retrieved from: (https://www.theatlantic.com/politics/archive/2011/06/the-war-on-drugs-t…).
[9] Abrams, Jim. 2010. “Congress passes bill to reduce disparity in crack, powder cocaine sentencing.” The Washington Post, July 29. Retrieved from: (https://www.washingtonpost.com/wp-dyn/content/article/2010/07/28/AR2010…).