The Color of Inequality Part 3: Structural Racism and Public Education
By: Mike Shields & Mohona Siddique
Date: June 4, 2020
AUTHORS' NOTE:
As the country was buckling under the weight of the COVID-19 pandemic, the widely broadcast killing of an unarmed Black man, George Floyd, by a white Minneapolis police officer along with Amy Cooper's threatening use of police force to confront Christian Cooper in Central Park added to a litany of events that precipitated renewed protests against police brutality across the nation. While some protests remained peaceful, like those in Camden, New Jersey, peaceful protests in Philadelphia incited civil unrest and resulted in violent confrontations. It is not the first time that communities in Philadelphia have protested against racial injustice and police brutality, and the events of recent weeks are not isolated. Rather, they exist within the historical context of the intersection of race and economic opportunity – and for Black Americans and many other communities of color in the U.S, economic opportunity and mobility still remain out of reach.
To provide context and data to inform ongoing conversations about structural racism and illustrate how these enduring inequalities have shaped present-day neighborhood and civic relations in Philadelphia, the Economy League of Greater Philadelphia is launching a special Leading Indicator series called The Color of Inequality. The series will highlight measures of racial and ethnic inequality in the City of Philadelphia to contribute to ongoing conversations about racism and prejudice.
Color of Inequality Part 3: Structural Racism and Public Education
The landmark 1954 U.S. Supreme Court decision in Brown v. Board of Education deemed the “separate but equal” system of racial segregation unconstitutional. Despite this momentous legal victory, most school districts in the United States have remained woefully segregated. In this week’s Color of Inequality, we provide some context for understanding unequal access to quality education and examine some of the lasting effects of this inequality in present-day communities across Philadelphia.

Unequal Access to Early Childhood Education
From neural development to social skills, a child’s early learning years set the foundation for future educational attainment. In the Commonwealth of Pennsylvania, the importance of early learning has been highlighted by significant state investments in the form of Pre-K for PA. Previous research conducted by the Economy League has shown the far-reaching benefits of investing in early learning—from individual student outcomes to overall taxpayer savings.
Despite these investments, access to quality early childhood education is starkly unequal – often falling along racial lines. Private and public Pre-K or daycare tends to be readily accessible to wealthier Non-Hispanic White communities while many communities of color lack access or the financial resources to compete for space in better-quality early-learning facilities. In fact, assessments of early childhood reading and math abilities usually show large discrepancies along measures of socioeconomic status, race, and ethnicity that correlate to the differences in access – with wealthier Non-Hispanic White children showing more preparation for kindergarten than their Black and Brown classmates due primarily to disparate access and financial resources [1]. See below for further reading on understanding the intersection of race and unequal access to early childhood education.

Local Tax-Based Funding
Most U.S. school districts are funded from local residential and business property taxes with a portion of funds coming from the state and federal government. With such a reliance on local property taxes, a diminished tax base can significantly impact the budget of a local school district – which is often the only educational option for communities of color who cannot afford private-school tuition. In Philadelphia, as in many other major U.S. cities, decades of middle-class “white flight” to the suburbs and rollbacks in state and federal education funding have led to severely underfunded inner-city schools. This reliance on a poorer tax-base to fund the local district poses issues for many inner-city communities of color:
- With a heavy reliance on local business taxes, times of economic downturn equates to less funding for public schools.
- Schools in communities of color are more susceptible to budget and resource constraints which increases student-to-teacher ratios, limits school supplies like textbooks, causes high teacher turnover, and fosters a disinvestment in learning.
- With limited spending per student, inner-city schools struggle to prepare students for higher education or sustainable employment.
- Many communities of color are “locked-in-place" because of a legacy of financial, residential, and occupational redlining which means they cannot escape their failing school district like wealthier white families.

White Suburban School Districts
As discussed in a previous edition of the Color of Inequality, past policy decisions incentivized the movement of wealthier Non-Hispanic White families out of cities and into the suburbs. While segregation was outlawed by the 1954 Brown v. Board of Education decision, policy-induced white flight led to de facto segregation of U.S. school districts. Most suburban school districts are majority Non-Hispanic White and due to relatively high property values have the means to spend substantially more money per pupil than urban school districts. Additionally, Non-Hispanic White parents are more likely to have the social and financial capital to send their children to private school, in search of smaller class sizes, greater perceived safety, more resources, and better ratings. In Greater Philadelphia, the racial divide among school districts is pronounced. Of the 13 school districts that surround the City of Philadelphia, two-thirds are majority Non-Hispanic White and spend roughly $5,000 or more per pupil annually than the School District of Philadelphia [3].

Criminalization of Inner-City Public-School Students
In addition to the fact that many people of color lack the resources to opt out of underfunded inner-city school districts, the increased criminalization of inner-city public schools has fostered a culture of distrust and disinvestment in learning. Since the 1990s, many public schools have seen a wave of “zero-tolerance” or strict discipline policies in response to increased national gun violence and inner-city gang activity [4]. In fact, the number of national school suspensions has doubled since the 1970s – with Black and Brown students accounting for the largest portion [5]. These strict discipline policies have disproportionately affected students of color who have been subjected to increased security within their own schools more than their white suburban counterparts. Many inner-city public schools “maintain order” with metal detectors, cameras, on-site police or security officers, random searches, immediate suspensions or expulsions, and in-school arrests [6]. These policies have sent more students of color into the criminal justice system rather than the workforce; a phenomenon known as the “School-To-Prison Pipeline.” More resources on the connections between public school disciplinary policies and the School-to-Prison Pipeline can be found here:

Beyond the Classroom – The Lasting Impacts of Unequal Education
The barriers faced by many students of color to access equal educational opportunity often have a lasting impact on their later achievements both in higher education and the workforce. These barriers manifest themselves in many ways. As of 2018, only a quarter of African American adults in the U.S. have earned a bachelor’s degree or higher – compared to almost 40 percent of Non-Hispanic Whites [7]. Further, the National Skills Coalition cites the racial educational attainment gap as a critical workforce challenge that negatively affects the national economy. In fact, the economy would have been $2.5 trillion times larger in 2015 had there been no racial gaps in income [8]. Below are several resources that demonstrate some of the concepts of how unequal access to education, and how the opportunity gap manifests itself beyond the classroom.
The Leading Indicator – The Neighborhood Impacts of School Performance
To visualize the connection between unequal access to education and economic impact, we look at how the performance of Philadelphia’s public and charter schools correlate with neighborhood measures of employment and wealth. While not all neighborhood children are required to attend their assigned catchment school, most children do attend their local neighborhood’s school. The performance of the local school can impact the neighborhood profoundly, particularly with respect to property values - as research by Ken Steif and others have shown. Figure 1 shows a simplified spatial relationship between school performance, household income, full-time employment, and the racial and ethnic composition of the neighborhood.
FIGURE 1
NOTE: Data were obtained from the School District of Philadelphia’s School Progress Report data for the 2016-2017 school year (curated on OpenDataPhilly) and five-year estimates of the 2018 American Community Survey maintained and curated by the U.S. Census Bureau. Only “District” and “Charter” schools were used for this map. Tracts were excluded from demographic measures if the population count was less than 500 residents.
The map uses the tiered performance measure of the City of Philadelphia’s School Progress Report that categorizes schools in descending order as “Model,” “Reinforce Performance,” “Watch,” or “Intervene.” The map shows that a disproportionate number of “Model” and “Reinforce” schools are located within higher income tracts with a high proportion of full-time workers. These tracts are also more likely to be majority-Non-Hispanic White.
The table in Figure 2 aggregates schools by performance category across census tracts by the racial or ethnic majority of their residents. It shows that a disproportionate share of Model schools (70 percent) and Reinforce schools (51 percent) are within majority-Non-Hispanic-White census tracts. These tracts also have the highest proportion of full-time workers and the highest median household income. Majority-Black/African American tracts, by contrast, have the highest proportion of Watch (41 percent) and Intervene (58 percent) schools – 1.6 and 3.1 times the share within majority-Non-Hispanic-White tracts, respectively. In addition, majority-Black/African American tracts have the lowest proportion of full-time workers in 2018 (32.8 percent) and the second lowest aggregated median household income ($33,074).
FIGURE 2
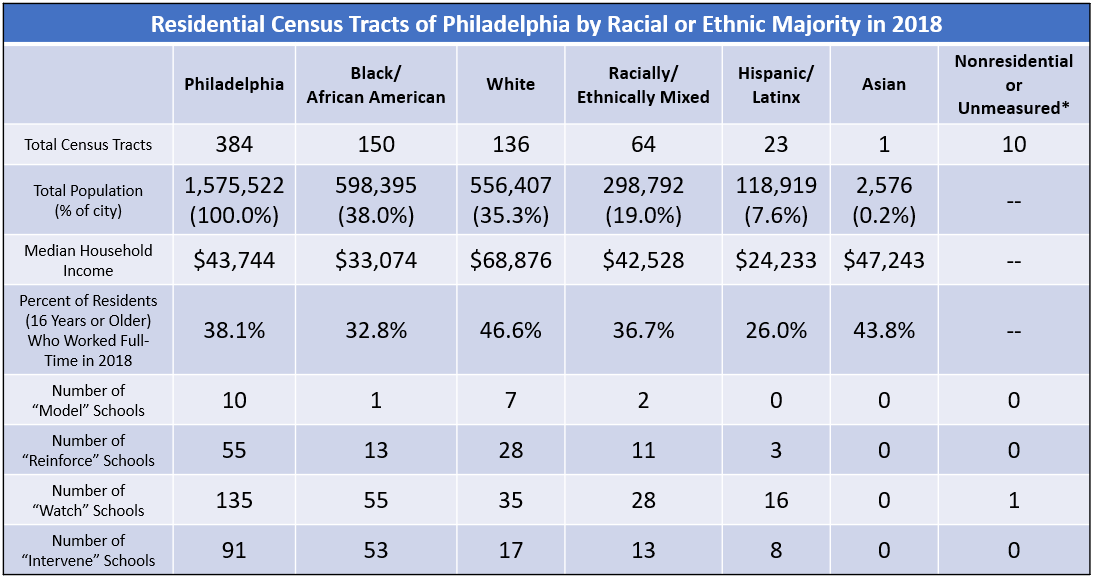
NOTE: Data were obtained from the School District of Philadelphia’s School Progress Report data for the 2016-2017 school year (curated on OpenDataPhilly) and five-year estimates of the 2018 American Community Survey maintained and curated by the U.S. Census Bureau. Only “District” and “Charter” schools were used for this table. Tracts were excluded from demographic measures if the population count was less than 500 residents.
As Philadelphia and other cities make tough budgetary decisions in the coming weeks and months—and as school districts do the same—it will be important to recognize the deep structural racism that has led to an enduring and deepening legacy of residential and educational segregation that has profoundly shaped the structure of opportunity in our city and country.
Works Cited
[1] García, Emma and Elaine Weiss. 2015. “Early Education Gaps by Social Class and Race Start U.S. Children Out on Unequal Footing.” Economic Policy Institute, June 17. Retrieved from: (https://www.epi.org/publication/early-education-gaps-by-social-class-an…).
[2] Jablow, Paul. 2015. “When it comes to education funding, what’s the deal with Philly schools?” WHYY, June 17. Retrieved from: (https://whyy.org/articles/when-it-comes-to-education-funding-whats-the-…).
[3] Camera, Lauren. 2019. “Segregation Reinforced by School Districts.” U.S. News, July 25. Retrieved from: (https://www.usnews.com/news/education-news/articles/2019-07-25/racial-a…).
[4] Aldridge, Sarah. 2018. “Criminalization and Discrimination in Schools: The Effects of Zero Tolerance Policies on the School-to-Prison Pipeline for Black Girls.” Aisthesis, 9(2):1-7. Retrieved from: (https://pubs.lib.umn.edu/index.php/aisthesis/article/view/1216).
[5] Nelson, Libby and Dara Lind. 2015. “The School to Prison Pipeline, Explained.” Justice Policy Institute, February 24. Retrieved from: (http://www.justicepolicy.org/news/8775).
[6] National Center for Education Statistics. 2019. “Fast Facts: School Safety and Security Measures.” Institute of Education Sciences. Retrieved from: (https://nces.ed.gov/fastfacts/display.asp?id=334).
[7] U.S. Census Bureau. 2019. “Educational Attainment in the United States: 2018.” U.S. Census Bureau. Retrieved from: (https://www.census.gov/data/tables/2018/demo/education-attainment/cps-d…).
[8] National Skills Coalition. 2019. The Roadmap for Racial Equity: An imperative for workforce development advocates. Washington D.C: National Skills Coalition. Retrieved from: (https://www.nationalskillscoalition.org/resources/publications/file/Rac…).