Inflation in Greater Philadelphia: The Fall 2023 Update
October 5, 2023
Author: Emmy Danforth
The Federal Reserve recently opted to hold interest rates steady for the second consecutive meeting, citing signs of an improving economy. [3] The interest rate increases of the last year were designed to slow the economy, decreasing inflation while maintaining low unemployment, in order to reduce the risk of a recession. Conventional thinking suggests that for inflation to go down, unemployment must go up, a sign of a slowing economy. Conversely, high demand for labor tends to inflate wages and drive inflation [1]. The central bank’s goal is to land gently on a happy medium, without unemployment spiking.
What You Need to Know
- The national unemployment rate hit a fifty-year low this spring at 3.1%. While the rate has increased slightly in recent months, reaching 3.8%, it is still on par with 2019 levels, and well below post-WWII norms.
- Greater Philadelphia’s unemployment rate increased slightly from the spring but at 4.7% is still lower than 2022’s average.
- While still higher than the national level, Greater Philadelphia’s unemployment rate is closer to the national level than any point in the last twelve years.
- Nationally, unemployment has decreased over the last year for Black, White, and Hispanic populations of the labor market, but has increased for the Asian population.
- The inflation rate, the 12-month change in Consumer Price Index, reached its peak in June 2022 at over 8%, and has been steadily decreasing since then.
- As of June 2023, Philadelphia’s inflation rate of 3.0% is the lowest in two years, reaching levels below April 2021 when inflation began its steep growth.
Unemployment and Inflation
Federal data from April 2023 indicates that unemployment is at a historic low, reaching levels not seen since 1969 [4]. Since April, unemployment has ticked up slightly, but the current rate is still on par with pre-pandemic rates. The unemployment rate represents the percentage of individuals who are actively seeking work but are currently jobless. Some economists see the recent jump in unemployment as a positive sign, as it likely reflects a return of more potential workers to the labor market [1] . With more people seeking work included in the calculation, the number of unemployed people and the corresponding unemployment rate go up.
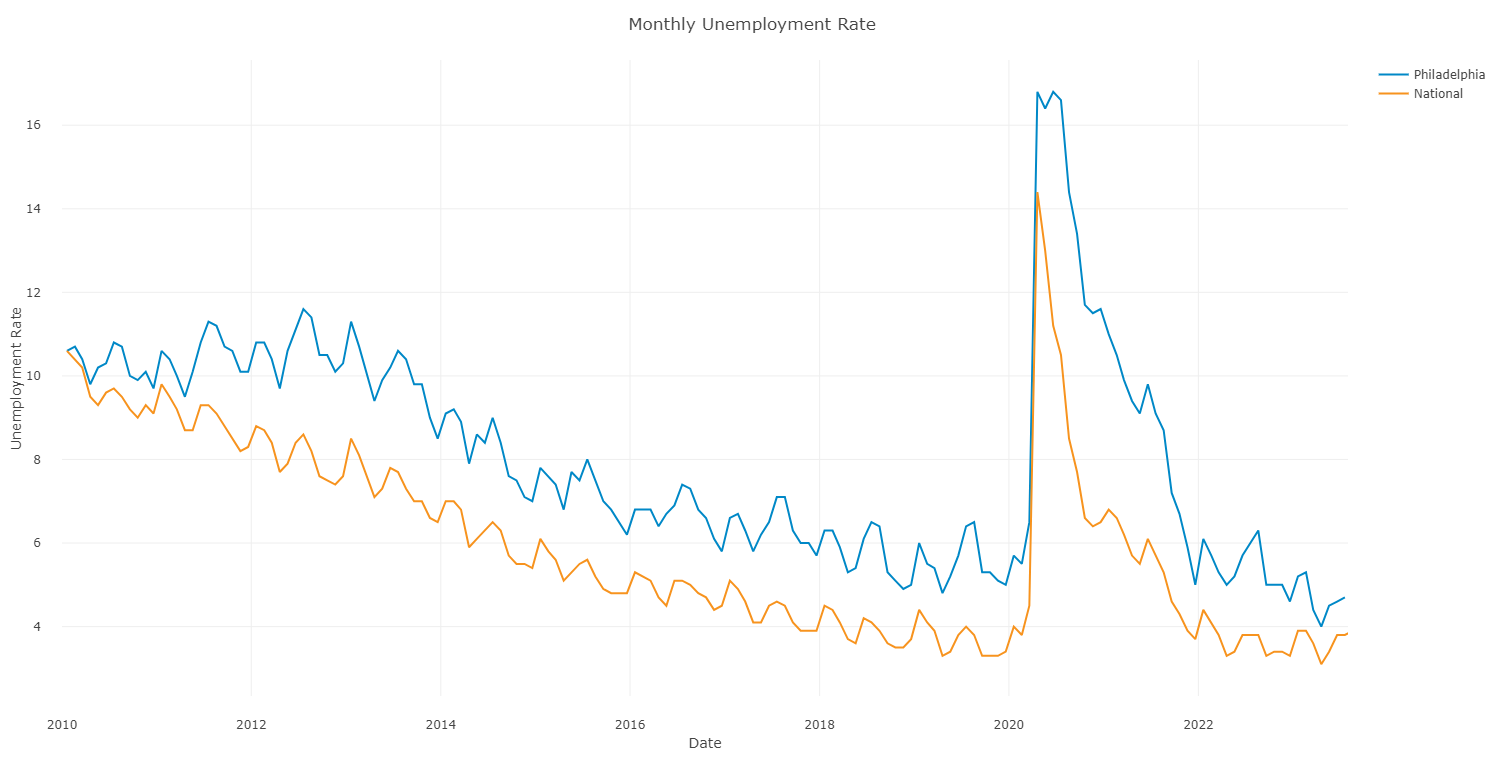
Comparing the national and local unemployment rates, we see that Philadelphia follows a similar trend to the country but maintains a relatively consistent gap above the national average over the last ten years. While at some points during 2020, Philadelphia’s unemployment rate was up to 6 percentage points above the national level, in 2023 the gap has narrowed steadily. Local and national rates haven’t been this close since 2011, with Philadelphia’s current unemployment sitting less than 1 percentage point above the national rate.
Figure 1
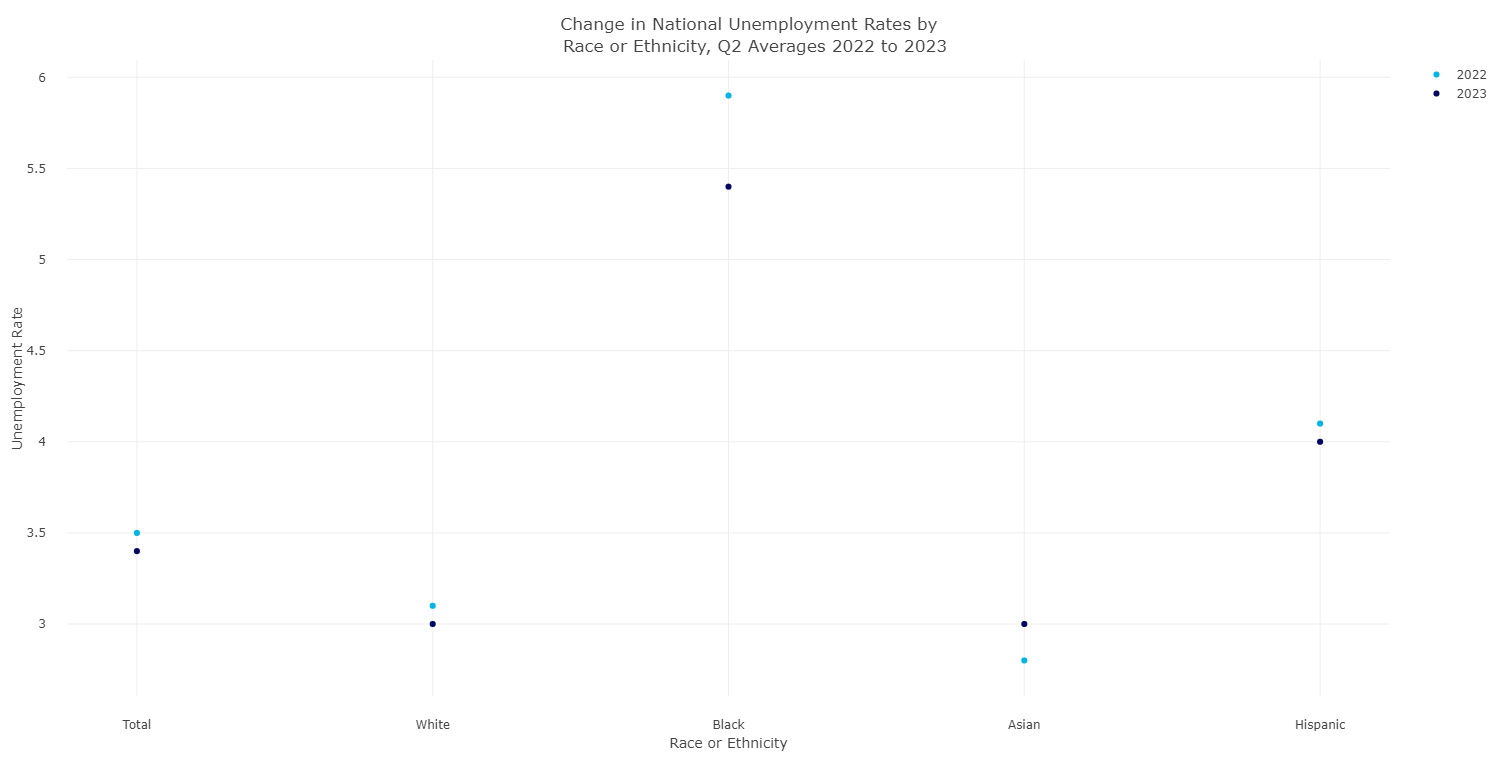
Although there is no publicly available data breaking down local unemployment rates by demographic groups, the Bureau of Labor Statistics does provide this information on a national level. With the exception of the Asian group, all groups have seen a decrease in year-over-year unemployment since the same period in 2022. The Black population of the labor force has shown the most significant decrease in unemployment, going from 5.9% to 5.4% unemployed.
Figure 2
A state-level analysis by the Economic Policy Institute provides the ratio of unemployment between racial and ethnic groups. In Pennsylvania, the ratio of Black to White unemployment rates is 1.3, while the ratio of Hispanic to White unemployment rates is 1.9. In Pennsylvania, as in the country, Black and Hispanic workers experience unemployment disproportionately to the White population.
Breaking Down the Consumer Price Index
The U.S. Bureau of Labor Statistics uses the Consumer Price Index (CPI) to represent changes in prices over time. The annual average CPI represents the proportional change in price over the year prior. With the 1983 annual average CPI serving as a benchmark of 100, the last ten year’s values are well above 200. We expect prices to continue to rise over time, and the CPI to continue to grow with the natural course of the economy. The inflation rate is the percentage change in the CPI over a 12-month period, so that for each monthly release, the inflation rate references the same month in the previous year.
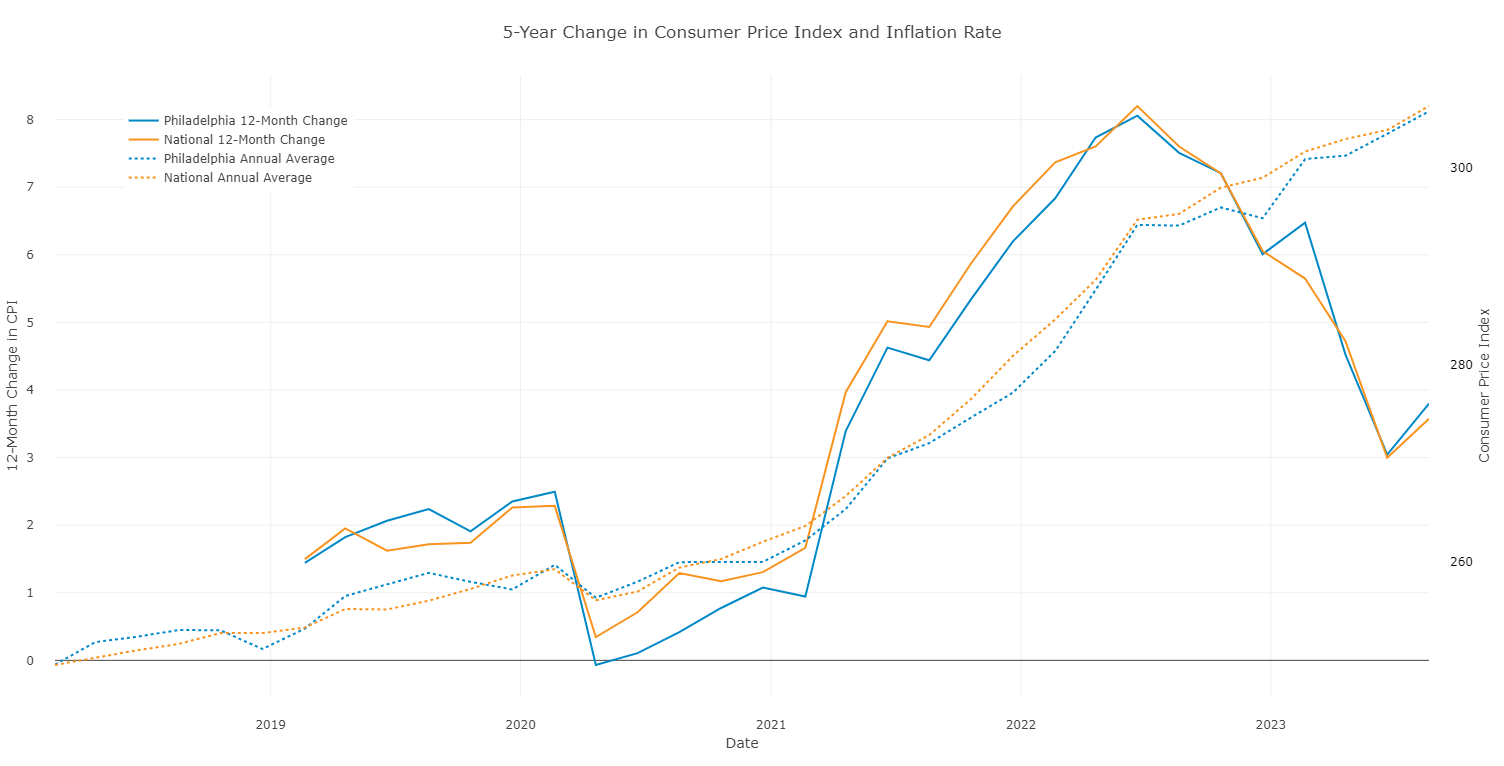
In this visual, the dotted lines represent the annual average CPI, the ratio of current prices to the benchmark prices in 1982. We see that this measure is steadily increasing over time. The solid lines represent the annual percentage change in CPI, or the inflation rate. The peak in June 2022, over 8% both nationally and locally, means that prices in June 2022 were 8% higher than prices in June 2021. In June 2023, we see a dip in inflation, with prices increasing just 3% over the previous year both nationally and locally. The most recent data release shows that inflation has increased slightly from June but is still below the prior reading in April.
Figure 3
Takeaways
According to traditional economic theory, there is an inverse relationship between inflation rate and unemployment rate. When there is low unemployment, demand exceeds the supply of labor, and wages tend to rise. In turn, prices go up as companies compensate for the additional expense of higher wages [6]. In these visuals, we see this inverse relationship hold true from April 2020 to April 2022: unemployment was falling while inflation was steadily increasing. We also see the inverse relationship mirrored in the relationship between national and local trends. While Philadelphia’s unemployment rate was higher than the national average, the local inflation rate was lower than the federal level. Since mid-2022, both unemployment and inflation have been decreasing, likely in response to Federal Reserve’s interest rate hikes. This offers the possibility of improved economic conditions, without triggering a recession.
Sources
[1] https://www.inquirer.com/economy/us-unemployment-report-august-2023-20230901.html#loaded
[2] https://www.bls.gov/regions/mid-atlantic/news-release/employmentcostindex_philadelphia.htm
[5] https://www.epi.org/indicators/state-unemployment-race-ethnicity/
[6] https://www.investopedia.com/articles/markets/081515/how-inflation-and-unemployment-are-related.asp