Know Your Price, Philadelphia: Housing Price & Demographic Change in Three Neighborhoods
The Economy League’s recently released study “Know Your Price Philadelphia” presents a detailed analysis of 70 years of Philadelphia property value data by race/ethnicity and neighborhood. The study compares property value trends in neighborhoods with majority white, Black, or Hispanic populations between 1950-2000 and 2000-2022. Using the rate of growth for home values in predominantly white neighborhoods as a benchmark, we identified substantial value gaps for homeowners in Black and Latino-majority neighborhoods. This gap – more than $57 billion – represents huge opportunity costs in terms of the accrual of generational wealth and the equitable provision of public goods.

The report makes evident that majority-white neighborhoods appreciated in value at a much faster rate than majority Black and Latino neighborhoods. It illustrates how neighborhoods that were majority Black and Latino in 1950 fared compared to neighborhoods that were majority white in 1950, as well as how neighborhoods that shifted from one demographic majority to another were saped accordingly. However, the report doesn’t tell the story of the neighborhood-level demographic changes that shaped these localities over time. Looking more closely at demographic changes, decade by decade, helps to explain the story of property devaluation and shifting populations.
In this and the next several Leading Indicators we examine Philadelphia neighborhoods in closer detail to offer insight into how demographic changes have shaped property values. Wissinoming, Stanton, and Elmwood are three geographically distinct neighborhoods that showed very low net property valuation between 1950 and 2022, based on the Know Your Price neighborhood analysis. In this Leading Indicator, we take the same neighborhood-level aggregations of decennial Census data to illustrate neighborhood population changes.
What You Need to Know:
Philadelphia’s total population decreased each decade from 1950 to 2010, then grew in 2020 to just below its 1980 level.
The citywide white population has been steadily decreasing since 1950; in 2020 the white population was just 1/3 as large as the 1950 count. Citywide, the Black population grew by 70% between 1950 and 1970 and has fluctuated by less than 5% each decade since.
Wissinoming’s total population was higher in 2020 than it was in 1960, and the composition has changed dramatically. It was 95% white from 1950-1990. Since 2000, the Black and Latino populations have been steadily growing. In 2020, the white population was still the largest single group but now makes up less than 50% of the neighborhood.
Stanton’s total population has been in decline since 1950, with its 2020 population less than 40% of its 1950 total. The neighborhood has been at least 90% Black since 1960, after an exodus of over 90% of the white population over the previous decade.
Elmwood has undergone a gradual but steady demographic transformation since 1950, beginning as a predominantly white neighborhood and becoming a predominantly Black neighborhood today. The most drastic change occurred between 1990 and 2000, when the white population decreased by more than 50% and the Black population more than doubled.
Philadelphia’s Changing Population
Figure 1 illustrates Philadelphia’s total population over time based on estimates for each racial or ethnic group. Note that in 1950 and 1960, the Census only reported population counts for three racial designations: white, Black, and other. Latino, Asian, and Native designations were added in 1970; multiracial was added in 2000. According to these Census estimates, Philadelphia’s total population declined each decade between 1950 and 2010, with an uptick in 2020. Of all the demographic groups, the total white population has declined most steadily and precipitously for the last seventy years and in 2020 was just 37% of its 1950 value.
Conversely, the Black population increased significantly from 1950 to 1970, nearly doubling from 376,000 to 653,000. Since 1970, the Black population has stayed relatively stable, maintaining a population between 631,000 and 662,000 for the last fifty years. The Latino population has been steadily rising each decade since 1970, increasing fivefold from 44,000 to 238,000 between 1970 and 2020. The Asian population grew significantly between 1980 and 1990, reached its peak in 2000, and has fluctuated in the following decades. Because the Black population has stayed relatively constant since 1970, and all other groups have grown in number, Philadelphia’s declining population is due primarily to the declining white population.
Figure 1: https://rpubs.com/edanforth/demo_phl
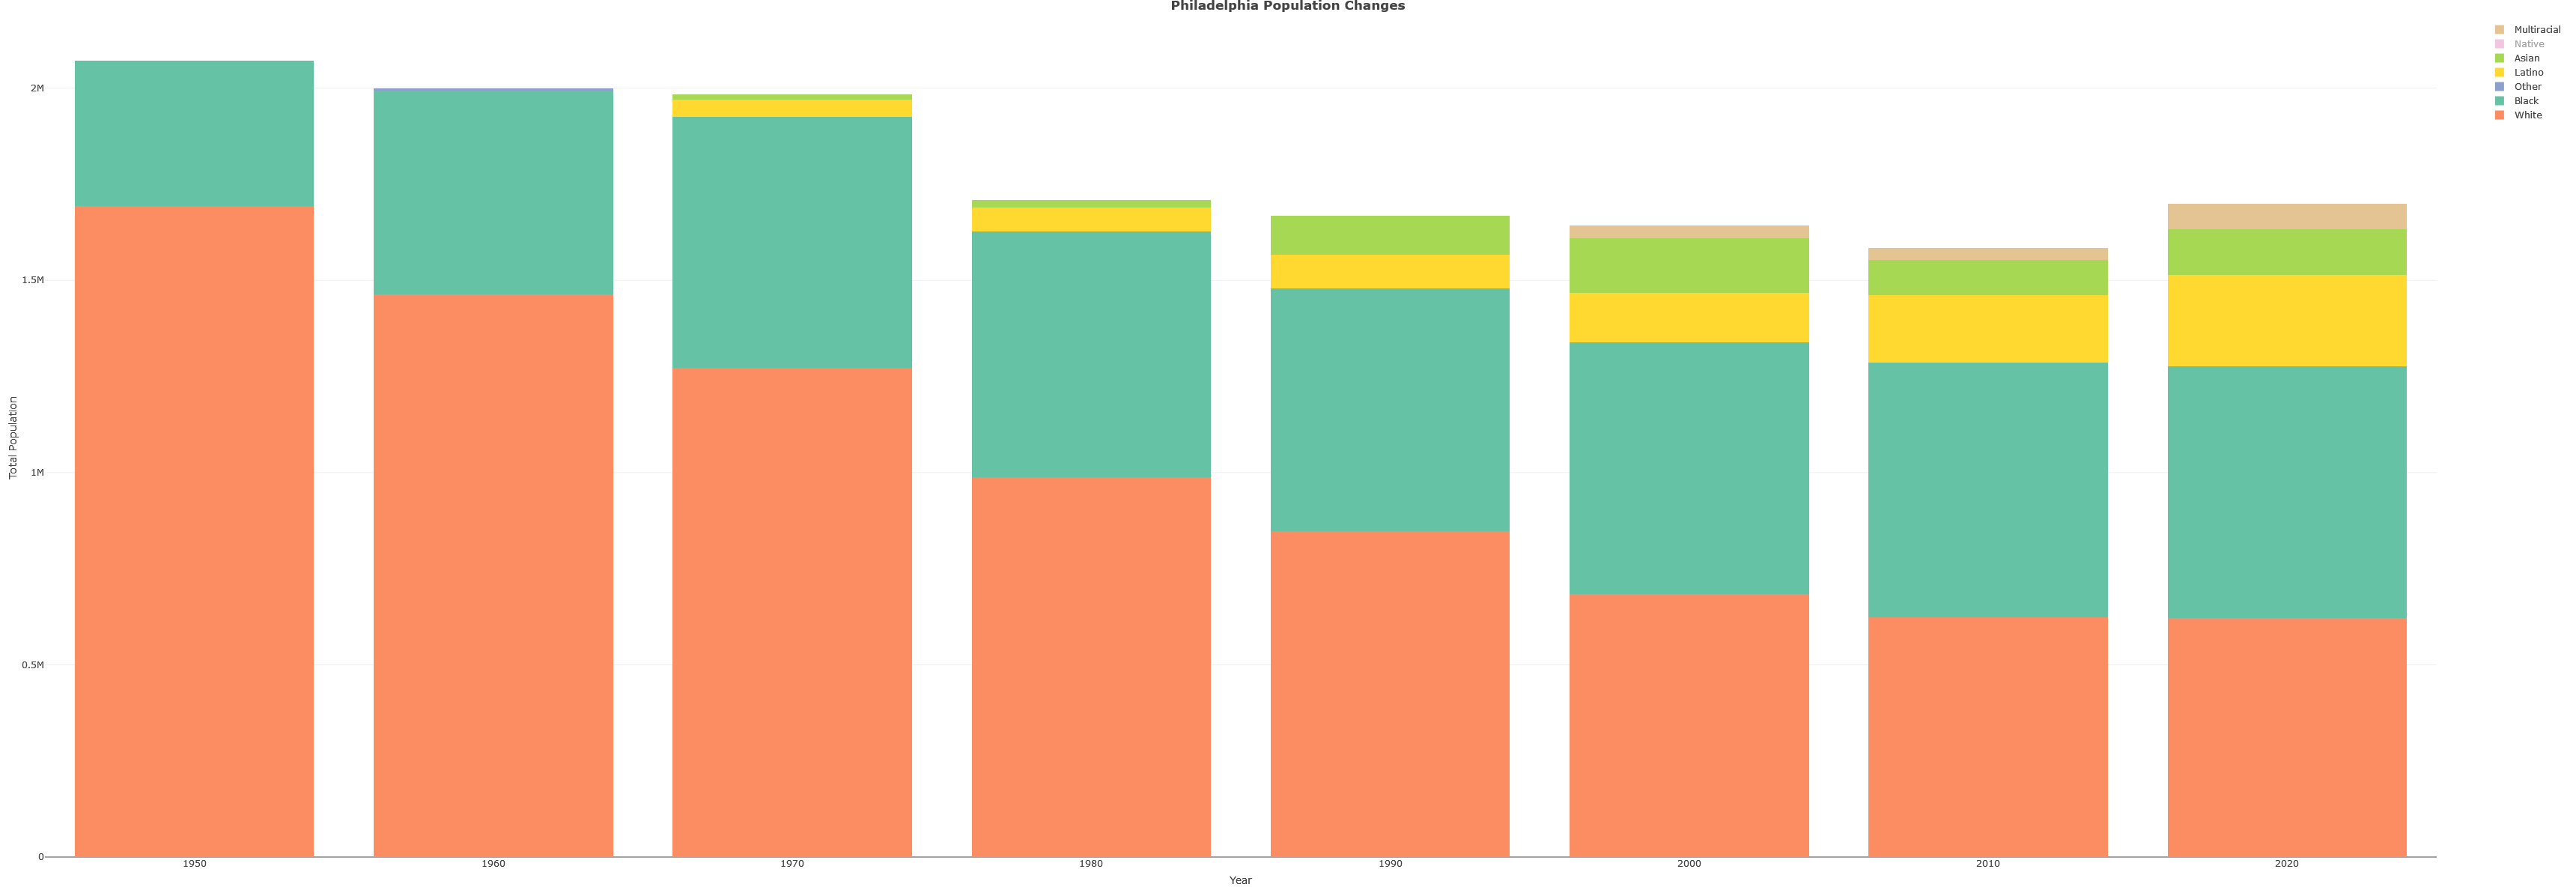
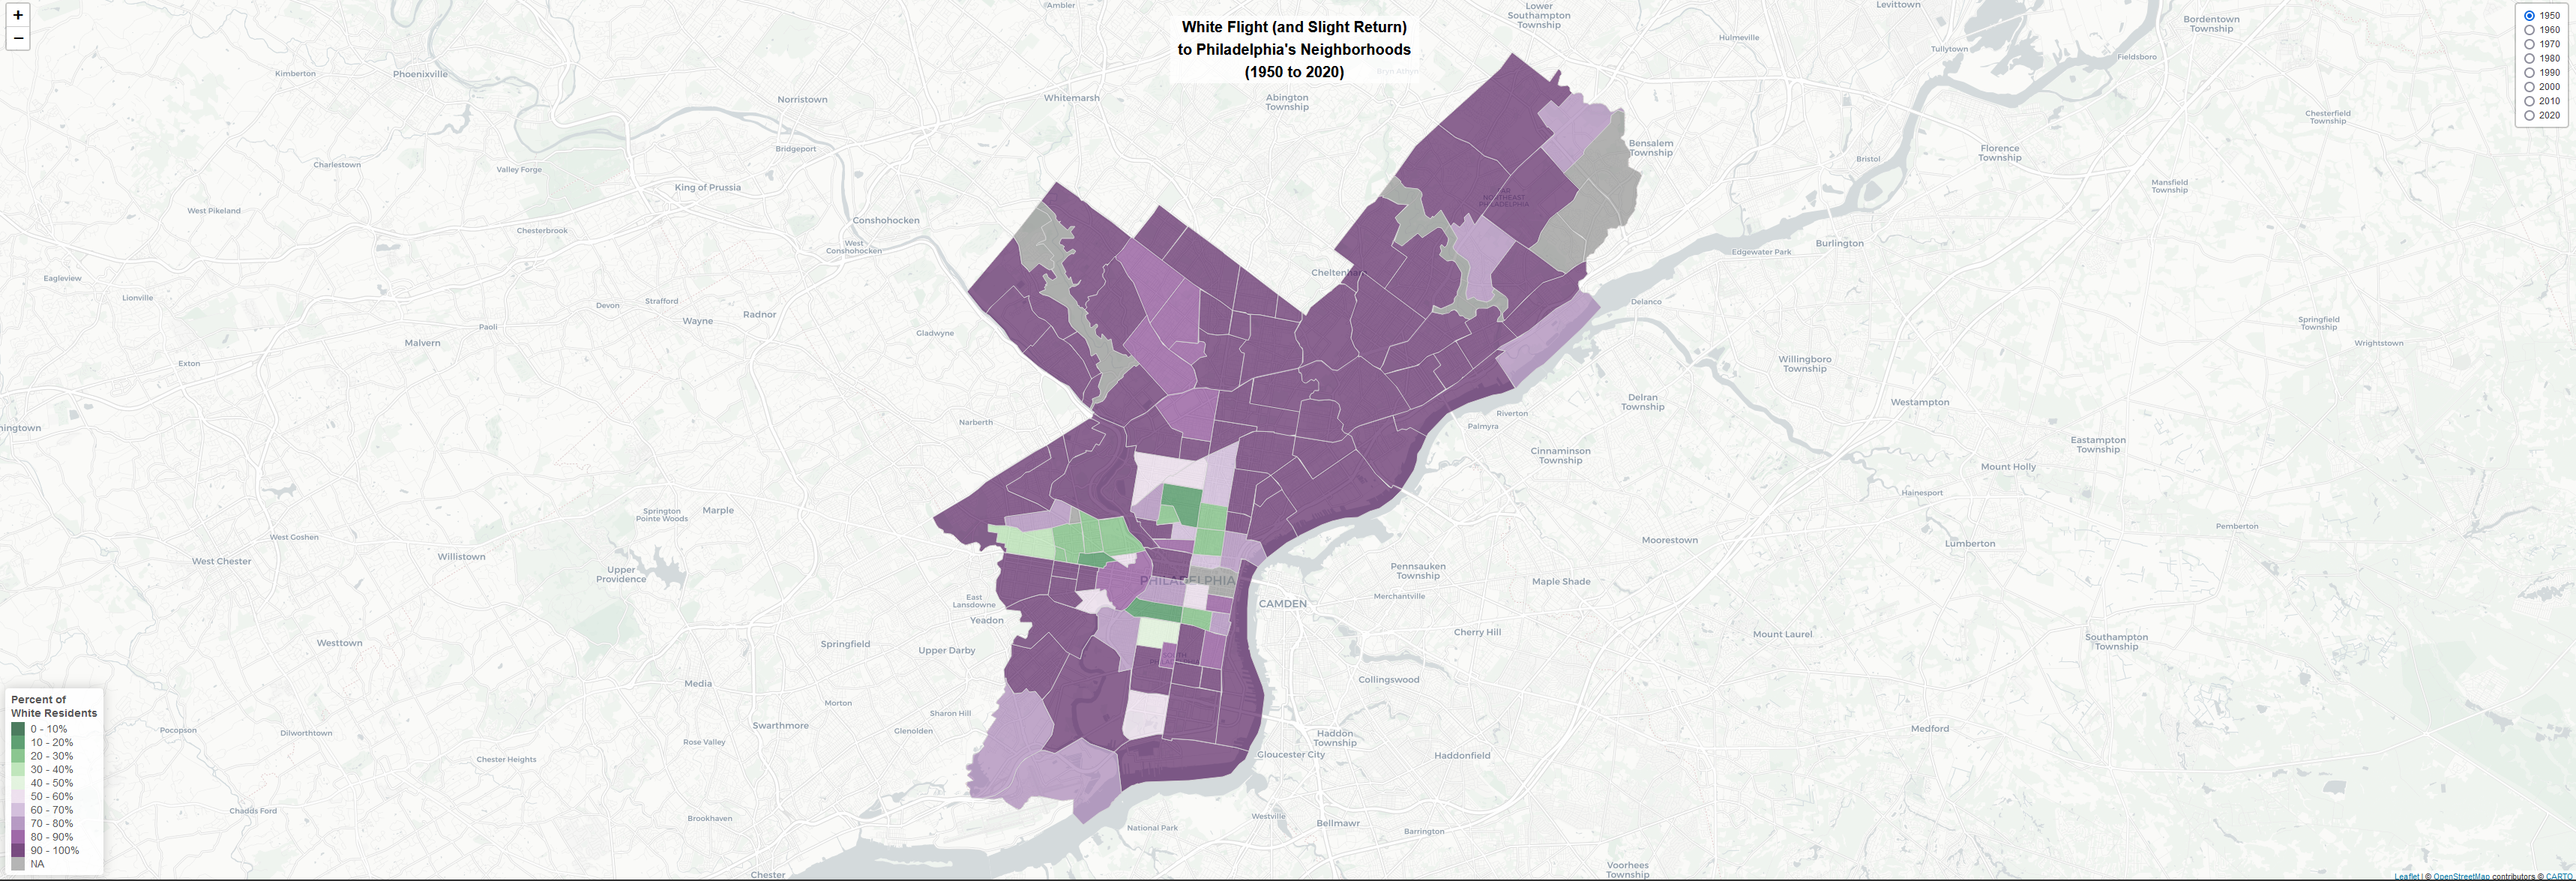
Figure 2 illustrates the neighborhood-level change in the white population between 1950-2020. In 1950, the majority of Philadelphia neighborhoods were predominantly white, with only a scattering of neighborhoods in North Central and West Philadelphia with populations under 50% white. In each of the following decades through 2000, neighborhoods where whites are in the minority expand north and southwest. Then, in 2010 and 2020, the white majority in the south and northeast decreases as some white residents return to Center City neighborhoods. This aligns with the city’s overall population change shown in Figure 1, where the decline of the white population is steady between 1950-2000 and then falls off in 2010.
The Northeast: Wissinoming
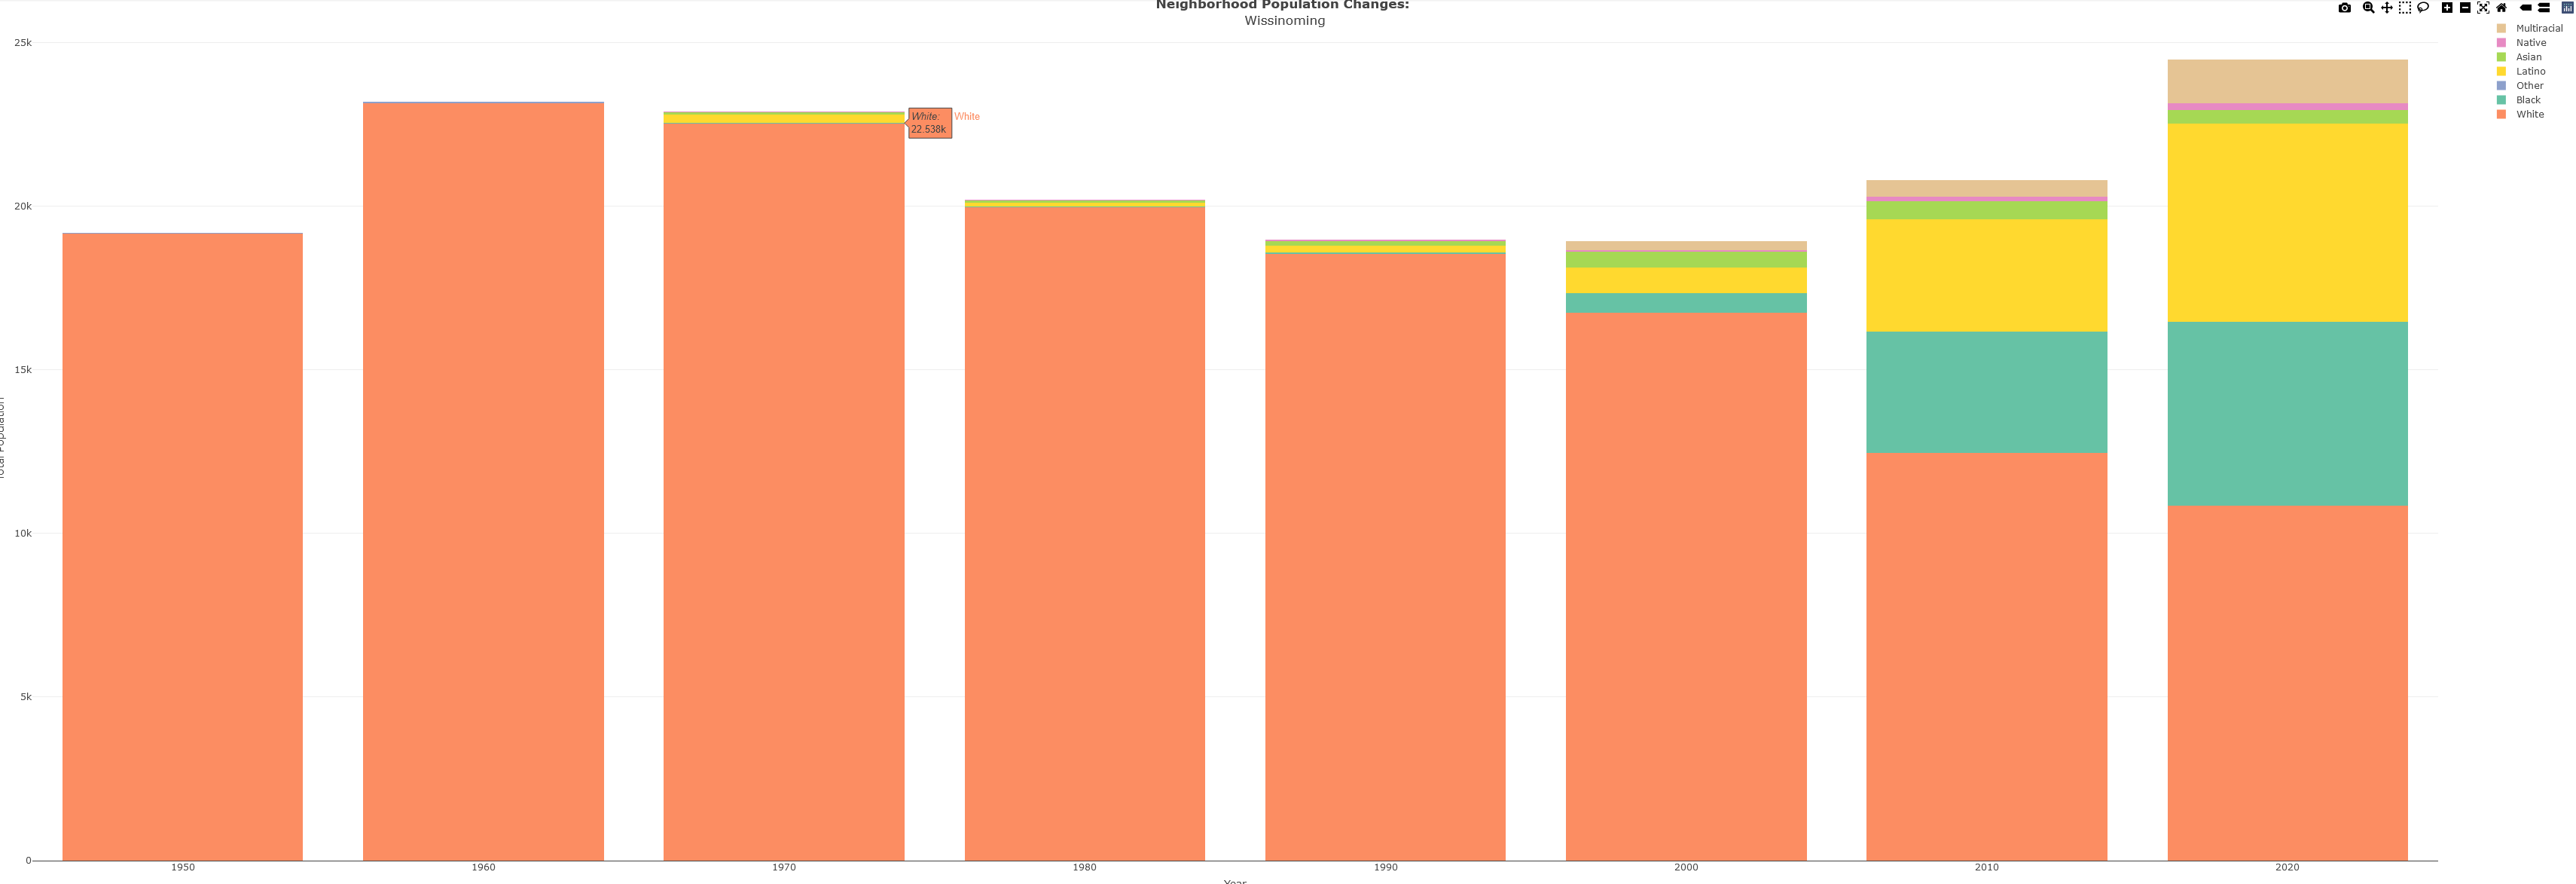
Wissinoming is located in the 6th City Council District, in the so-called “near” Northeast section of Philadelphia, abutting the Delaware River. The neighborhood was more than 95% white from 1950 and 1990. Between 1990 and 2000, the white population decreased to 88%, then sharply fell to 60% between 2000 and 2010. By 2020, whites represented just 44% of the neighborhood’s population.
Like the city overall, the white population in Wissinoming has been consistently declining since 1960. However, other groups have increased in representation starting in 2000. Both Black and Hispanic/Latino populations have increased from several hundred in 2000 to approximately 6,000 each in 2020. The overall population of the neighborhood declined from 1970 through 2000 and then rebounded to surpass 1960 levels in 2020, driven by an influx of Black and Latino residents.
Wissinoming’s property values have fluctuated significantly over the decades, with two sharp decreases between 1950-1953 and between 1957-1963. Although property values have been slowly trending upwards since then, going through a series of peaks and valleys, they have never returned to 1950 levels.
Figure 4:

North Philly: Stanton
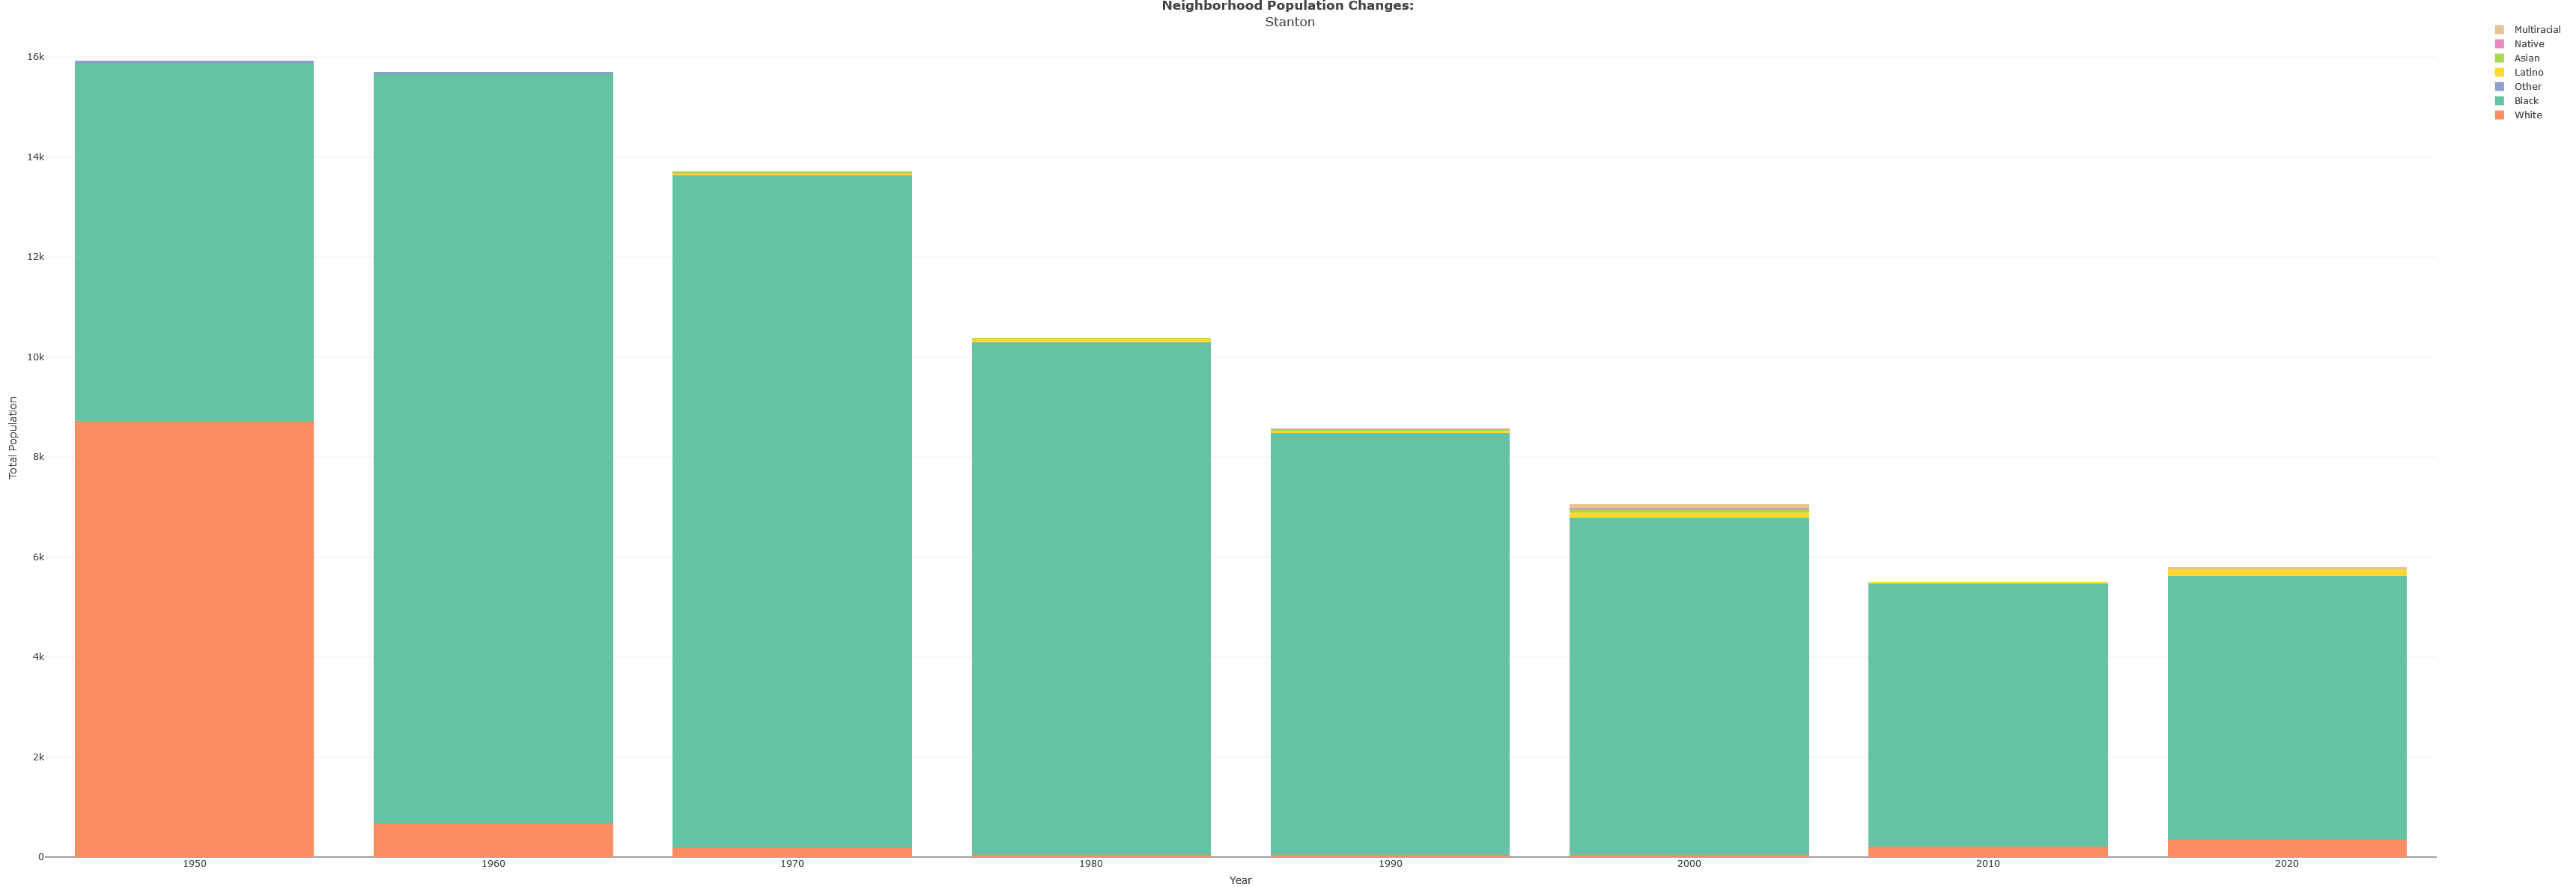
Stanton is in the 5th Council District, in north central Philadelphia, nestled between Strawberry Mansion and Temple University. Stanton has been a predominantly Black neighborhood since 1960, after undergoing an exodus of the white population in the previous decade. While the neighborhood was 55% white in 1950, the white population fell by more than 90% over the following decade. The neighborhood has consistently been at least 90% Black through 2020. The Latino population, first appearing in Census estimates in 1970, has been a consistently small proportion of the Stanton population, staying under 3%.
However, unlike Wissinoming, which saw demographic shifts through both loss of whites and gain of Blacks and Latinos, Stanton’s population first lost nearly its entire white population from 1950-1960 and then nearly two-thirds of its Black population over the ensuing 6 decades. From a height of nearly 16,000 residents in 1950, today Stanton has fewer than 6,000 residents, a decline of 62%.
Figure 5: https://rpubs.com/edanforth/demo_stanton
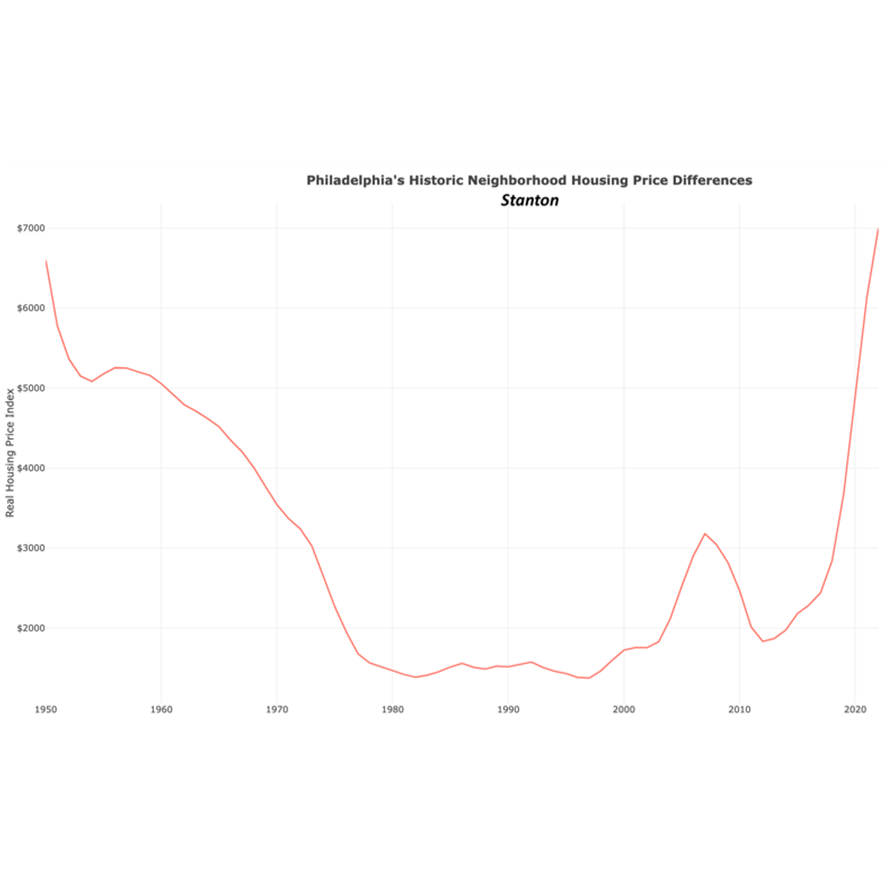
Property values in Stanton steadily declined between 1950 and 1982 and saw little change until 1998, when they began to slowly increase. After some fluctuation, values have been steadily increasing since 2012. In 2022, the housing price index exceeded 1950 levels for the first time.
Figure 6:
Southwest: Elmwood
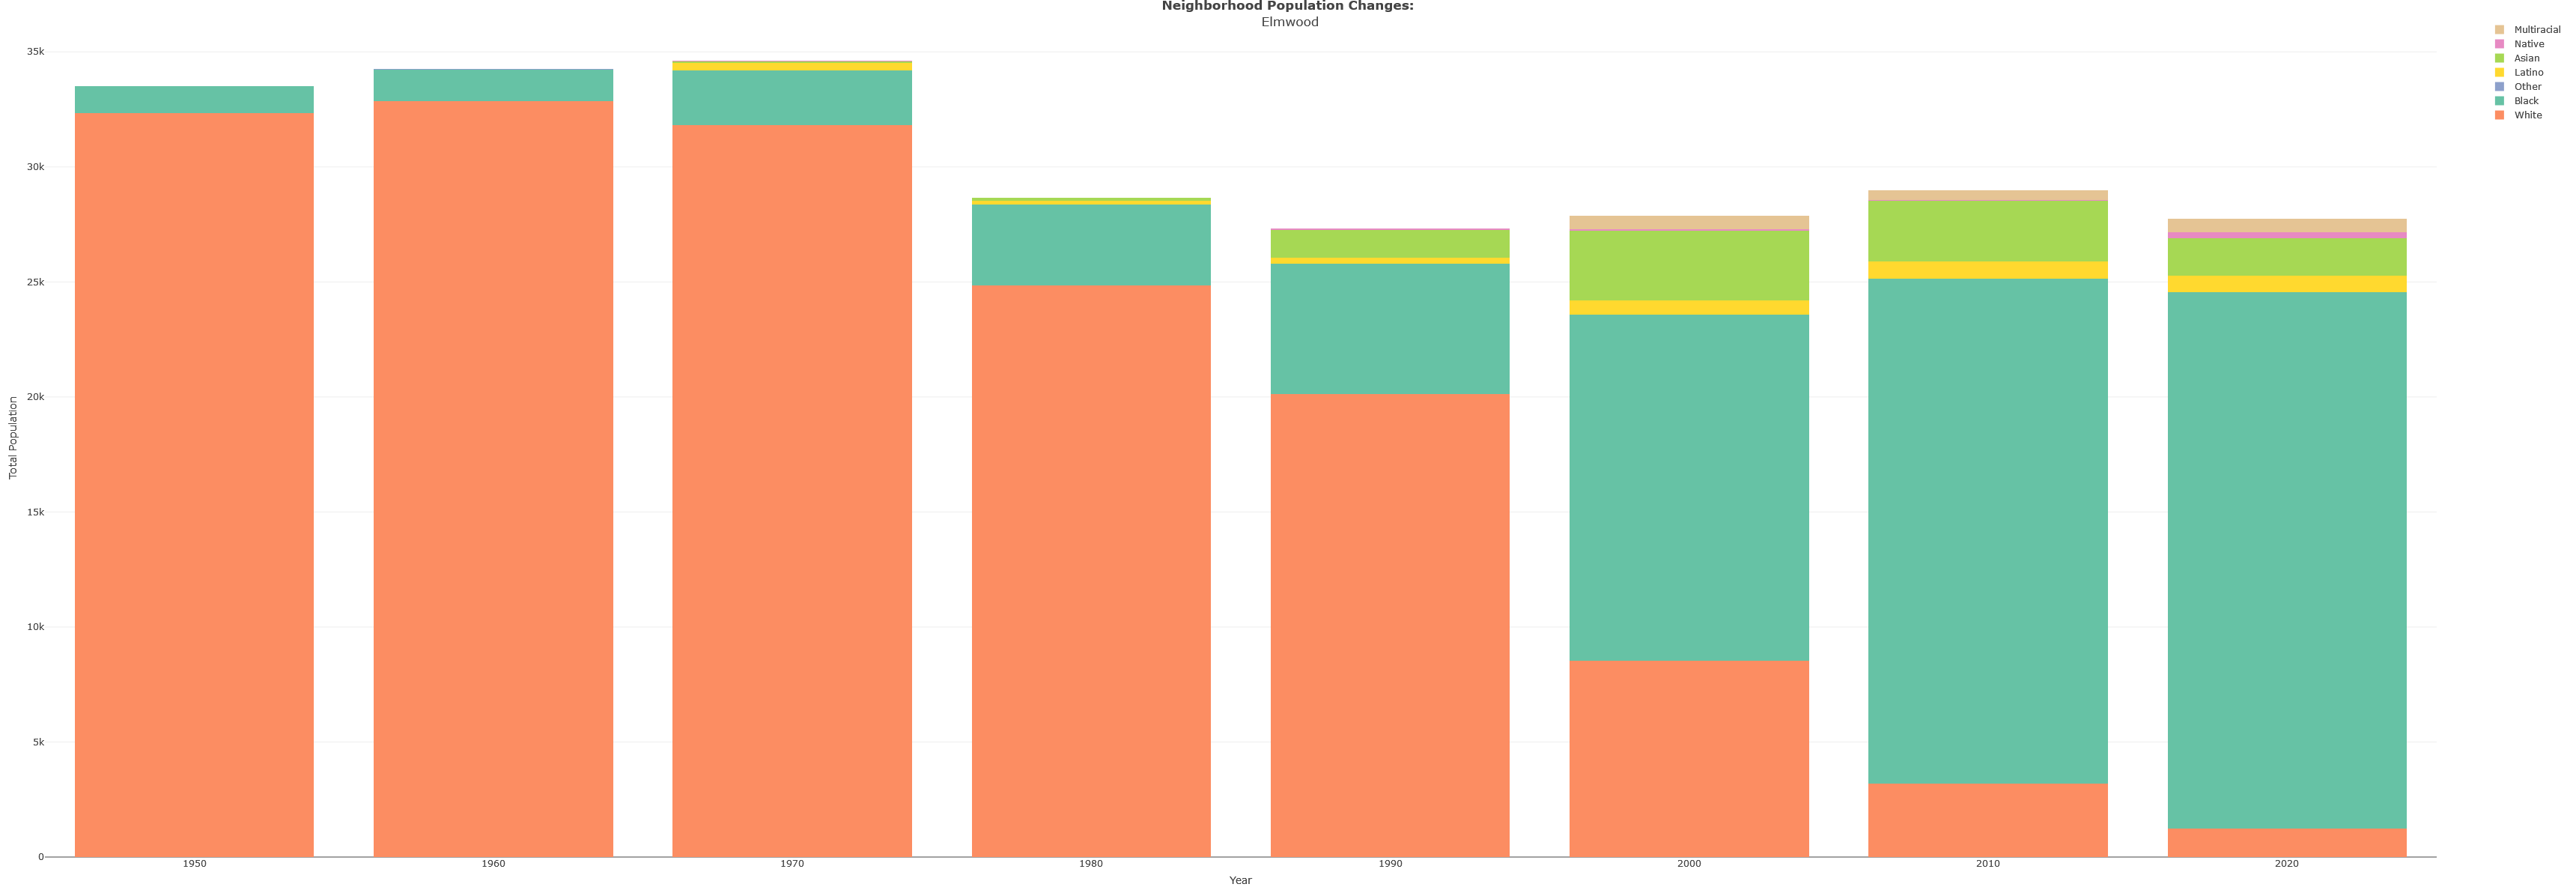
Elmwood is situated in the 2nd Council District, on the southwestern edge of Philadelphia, touching the west banks of the Schuylkill River and the border of Darby Township. Like Stanton and Wissinoming, Elmwood has undergone a notable demographic transformation since 1950. While Elmwood was a predominantly white neighborhood in 1950, it is a predominantly Black neighborhood today. This transformation has been steady and gradual, with the largest change appearing in 2000. From 1990 to 2000, the white population decreased by more than 50% and the Black population nearly tripled. In 2000, the neighborhood was majority Black for the first time, and this Black majority only grew in the following decades as the white population continued to diminish. Latino representation has remained under 3% of the population for all Census estimates, while the Asian population reached its maximum of 11% in 2000 and has dropped to 6% in 2020.
While the total neighborhood population dropped by 17% from 1970 to 1980, it has remained relatively constant for the last forty years, staying between 27,000 and 29,000. It increased slightly from 1990 to 2010, then dropped again in 2020.
Figure 7: https://rpubs.com/edanforth/demo_elmwood
Elmwood home price values peaked in 1955 before beginning a gradual and variable decline, reaching its lowest point in 2014. Prices have been steadily increasing since 2014, but are still significantly below the neighborhood’s prices in the 1950s and 1960s.
Figure 8:

Conclusion and Takeaways
Whether facing population loss or significant demographic shifts or both, a neighborhood’s housing market is significantly impacted by both supply and demand as well as racial and ethnic composition. As shown in the full Know Your Price report, neighborhoods that are majority Black or Latino/Hispanic today have on average experienced a cumulative devaluation of roughly $850k and $1 million, respectively, compared to majority white neighborhoods. In these neighborhood-level analyses, we have shown that both overall population loss and significant decrease in white representation are correlated with the property devaluation. The analysis suggests that racial and ethnic composition is a more significant driver of value than overall population, since even a growing neighborhood like Wissinoming, which has seen steady population growth from 1990 to 2020, has failed to see requisite property value increases.