Philadelphia’s Imported Squeeze: High Prices, Flat Job Growth, and the Risk of a One-Engine Economy

Philadelphia’s Imported Squeeze: High Prices, Flat Job Growth, and the Risk of a One-Engine Economy
Executive Summary
The Philadelphia metropolitan statistical area (MSA) is experiencing near-stagnant payroll growth (+0.1% year-over-year) alongside the Northeast Corridor’s highest inflation (Consumer Price Index for All Urban Consumers, or CPI-U, at 4.8%). Payroll growth is concentrated almost entirely in Education and Health Services (+2.0%), while seven of ten major sectors are contracting. When placed alongside corridor peers, the pattern gains clarity: Washington, DC’s deep contraction (−2.9%) is driven by federal workforce reductions; Boston’s decline (−0.5%) reflects biotech layoffs and research-funding freezes; New York barely grows (+0.4%) on Wall Street strength. The inflation acceleration appears driven primarily by the energy-price shock following the Iran conflict that began February 28, 2026, with secondary contribution from tariff passthrough. This combination of weak growth and elevated inflation — unique to Philadelphia among its corridor peers — raises the question of whether the metro is entering a stagflationary episode. Forward-looking indicators will be decisive.
What You Need to Know
Philadelphia’s economy is not in free fall, but it is losing momentum. Total nonfarm payroll growth in the Philadelphia-Camden-Wilmington MSA was essentially flat in April 2026, rising just 0.1% year-over-year after two months of contraction. In a metro economy with more than 3 million payroll jobs, that translates to only a few thousand net positions — a level too small to signal broad-based expansion.
- The metro’s growth is increasingly dependent on one sector. Education and Health Services grew 2.0% year-over-year and remains Philadelphia’s main employment engine, while most other major sectors are either flat or contracting. Professional and Business Services turned slightly positive in April, but it has not yet shown enough sustained momentum to serve as a reliable second engine.
- Philadelphia is facing the corridor’s sharpest inflation squeeze. CPI-U reached 4.8% in April, higher than New York, Washington, DC, and Boston. CPI-W, which more closely reflects the spending patterns of wage earners and clerical workers, rose an estimated 5.3%, suggesting that working households may be feeling an even sharper affordability squeeze than the headline number indicates.
- Much of the pressure is imported rather than locally generated. The inflation spike appears to be driven primarily by energy prices following the Middle East oil shock, with additional pressure from tariff passthrough. At the same time, federal workforce reductions in Washington, DC and related contractor cutbacks are creating spillover risks for Philadelphia’s government and professional services sectors.
- The central question is whether this is a temporary shock or a more durable slowdown. If energy prices moderate, professional services continues to recover, and healthcare hiring remains stable, Philadelphia could avoid a deeper downturn. But if inflation stays elevated, federal spillovers deepen, Medicaid cuts begin to affect hospital finances, or professional services weakens again, the region could face a more persistent affordability-and-employment squeeze.
The next two to four months will be decisive. The most important indicators to watch are initial unemployment claims, WARN notices, job postings, wage tax receipts, hospital margins, Medicaid enrollment churn, PhilaPort volumes, building permits, and federal contract terminations. Together, these will show whether Philadelphia’s current weakness is stabilizing — or spreading.
1. Philadelphia’s Employment Picture
Payroll Trajectory: November 2025 – April 2026
Total nonfarm payrolls in the Philadelphia MSA posted year-over-year (YoY) changes of +0.3%, +0.3%, +0.2%, −0.2%, −0.3%, and a preliminary +0.1% from November 2025 through April 2026.1 The metro crossed into outright YoY contraction in February and March before barely returning to positive territory. In an economy of 3.1 million payroll jobs, +0.1% represents roughly 3,000 net positions — well within the margin of statistical noise and below the pace needed to absorb population growth.
The household survey paints a more favorable picture. The unemployment rate peaked at 4.8% in February (up from 4.0% in December) before declining to a preliminary 3.9% in April. The civilian labor force expanded by roughly 40,000 from February to April, while household employment surged by 66,000 over the same period. When the household survey outpaces the establishment survey by this magnitude, it often reflects growth in self-employment, gig work, or informal arrangements rather than stable payroll positions.
Sectoral Composition: One Engine, Many Anchors
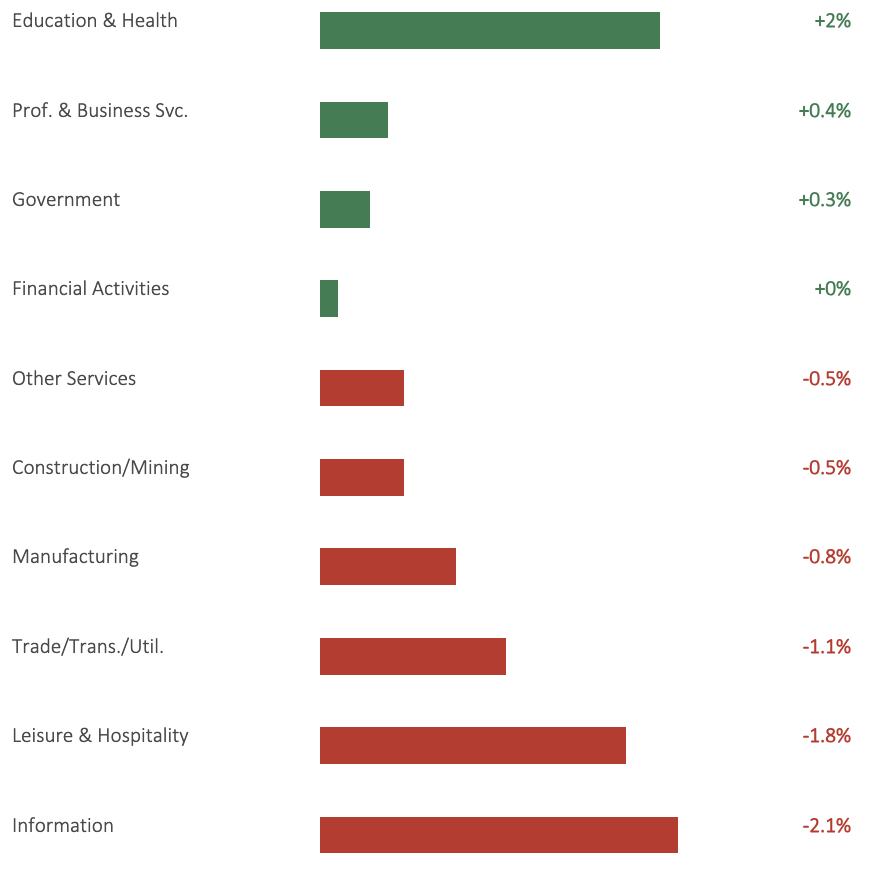
Source: BLS Economy at a Glance
Education and Health Services (+2.0%, 770,300 jobs) is doing the heavy lifting, with consistent positive readings throughout the period: +2.5%, +2.5%, +2.7%, +1.8%, +1.8%, +2.0%. This reflects the structural weight of the metro’s four academic medical centers, which have $2.3 billion in active capital expansion,2 including CHOP’s $710 million capital program.3
Professional and Business Services (+0.4%, 503,100 jobs) turned slightly positive in April after months of contraction (−0.2%, +0.2%, −0.1%, −0.3%, −0.5%). This sector’s trajectory is the key swing variable: a sustained rebound would provide a second growth engine; a relapse would leave the metro entirely dependent on healthcare.
Trade, Transportation, and Utilities (−1.1%, 532,600 jobs) has been contracting steadily, with YoY readings worsening from −0.7% in November to −1.8% in February before moderating slightly. Leisure and Hospitality (−1.8%, 272,700 jobs) is notable because this sector normally benefits from spring seasonal hiring — a negative YoY reading in April suggests structural softening beyond seasonal patterns. Information (−2.1%, 50,200 jobs) has been in persistent decline, reflecting the national retrenchment in media, technology, and telecommunications.
2. Corridor Comparison: Where Philadelphia Sits, and Why

Not a single corridor metro is growing payrolls at a healthy rate. But the nature and driver of each slowdown differs and understanding the causes illuminates what is unique about Philadelphia’s position.
Washington, DC (−2.9%): The Federal Workforce Contraction
Washington’s deep decline is driven by a single identifiable cause: federal workforce reductions carried out through the Department of Government Efficiency (DOGE) and related restructuring. Government employment in the DC metro is down 6.7% YoY, with the Pew Research Center estimating a 10.3% contraction in federal employment during 2025.45 The spillover into Professional and Business Services (−3.7%) reflects the contraction of consulting firms and IT contractors that depend on federal contracts — Booz Allen Hamilton announced 2,500 layoffs, and Deloitte saw at least 129 federal contracts terminated.67
The federal workforce contraction matters directly for Philadelphia. Per the Philadelphia Inquirer, the 11-county Philadelphia MSA lost an estimated 3,906 federal jobs (−16.7%) from January 2025 through February 2026.8 The IRS Philadelphia campus received a Reduction in Force (RIF) notice.9 Philadelphia’s Government sector is currently stable at +0.3%, but the contractor channel may explain some of the weakness in Professional and Business Services earlier in the period.
Boston (−0.5%): Research Funding and Biotech Retrenchment
Boston’s contraction is broader-based than Washington’s and harder to attribute to a single cause. Professional and Business Services (−1.2%) is being weighed down by biotech and life-sciences layoffs following National Institutes of Health (NIH) funding freezes and grant cancellations. Education and Health Services — typically Boston’s anchor — has stalled at +0.1%, likely reflecting the downstream effects of federal research funding cuts on the university and hospital employment complex. Government itself is contracting (−0.6%), and Information continues to decline (−1.6%).
The contrast with Philadelphia is instructive: both metros are anchored by academic medical centers and universities, but Philadelphia’s Ed & Health sector (+2.0%) has so far been more insulated from the NIH headwinds, likely because the metro’s healthcare growth is driven more by clinical care expansion and demographic demand than by research funding. The Inquirer reported in March 2026 that over the past decade, the Philadelphia-Camden-Wilmington region added roughly 184,000 jobs, and more than 132,000 of those — over 70% — were in healthcare. Crucially, the growth wasn’t in research-intensive hospital settings. Hospital jobs across the Philadelphia region grew only 6% over the decade (61,000 to 64,000). The engine was clinical care delivery: ambulatory care jobs in the city jumped 53%, from 33,500 in June 2015 to 51,200 in June 2025, with almost half of that growth — 45% — coming from home healthcare services, including surgical centers, home nursing care providers, and health aides. That’s a story about demographic demand and the shift to outpatient settings, not grant funding.
However, Philadelphia’s research institutions are actually quite vulnerable. Penn alone received more than $700 million in NIH funding in 2023, supporting thousands of jobs. Penn’s interim president estimated the indirect cost cap could reduce federal funding to Penn by nearly a quarter of a billion dollars per year, and institutions including Temple, Drexel, Jefferson, and Children’s Hospital of Philadelphia also stand to lose big. The SCIMaP interactive map estimated a possible economic loss of $322 million in Philadelphia County alone from the proposed cuts. Additionally, more than 80 scientific grants in Pennsylvania have been confirmed as impacted by cuts or freezes, with losses believed to total nearly $40 million..
The reason it hasn’t shown up in the employment data yet is threefold: courts blocked the indirect cost cap, Congress actually increased the NIH 2026 budget, and even at full exposure, the research-funded positions are a small fraction of the metro’s roughly 596,500 healthcare and social assistance jobs. The clinical care workforce — outpatient, home health, elder services — is too large for even significant research cuts to move the sector-level needle.
New York (+0.4%): Wall Street as a Differentiator
New York is the corridor’s best performer, but only marginally. Its payrolls posted three consecutive months of YoY contraction (−0.5% to −0.6%) before rebounding in April. The rebound was driven by Financial Activities (+0.9%) and Professional and Business Services (+0.8%) — diversification that Philadelphia lacks. New York’s Information sector is actually growing (+0.6%), while it is contracting in every other corridor metro.10
What’s Universal: Leisure, Hospitality, and Trade
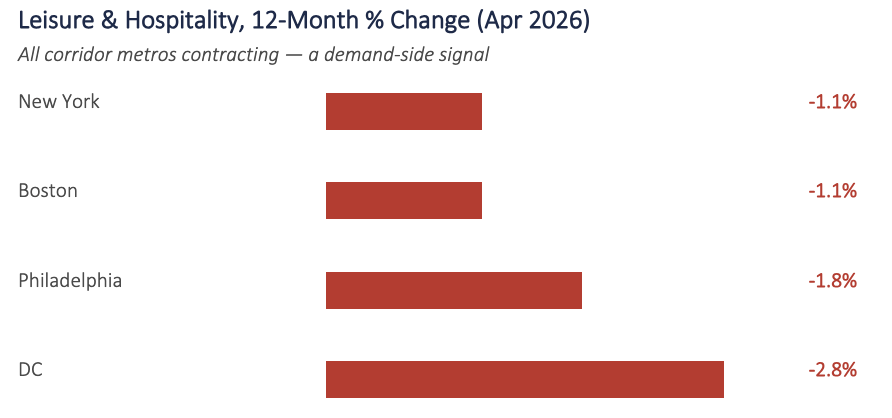
All corridor metros contracting — a demand-side signal
Leisure and Hospitality is declining across every corridor metro. This universality points to demand-side causes rather than metro-specific factors: a broad consumer spending pullback, falling international tourism (down roughly 5.5% nationally in 2025),11 and tariff-driven food-cost passthrough compounding margin pressure on restaurants. National hotel occupancy fell for nine consecutive months through late 2025.12 Trade, Transportation, and Utilities is also contracting in four of five metros, consistent with weakening consumer goods demand and the tariff-driven front-loading-then-collapse pattern in port volumes.
3. Inflation: Philadelphia’s Acceleration in Context
The Philadelphia CPI: What’s Driving the Spike
Philadelphia’s CPI-U decelerated from 3.9% in December 2025 to 3.5% in February 2026 — a trajectory that appeared to be converging toward the Federal Reserve’s 2% target — before reversing sharply to 4.8% in April.13 The BLS component decomposition points to energy as the primary driver: Philadelphia energy prices swung from +7.1% YoY in February to +21.6% in April. Given energy’s roughly 8% basket weight, this accounts for over a full percentage point of the 1.3 percentage-point headline acceleration. Core CPI (excluding food and energy) moved more modestly, from 3.5% to 3.8%. Shelter actually decelerated from 3.7% to 3.4%. Food rose from 1.9% to 3.1%.
The energy spike is consistent with the timing of U.S.-Israeli military operations against Iran that began February 28, 2026.14 Brent crude jumped from approximately $72 per barrel to above $119 at its peak, after Iranian forces declared the Strait of Hormuz closed.15 This shock hit all corridor metros simultaneously.
Tariff passthrough appears to be a secondary contributor. Goldman Sachs estimates 72% tariff passthrough after twelve months, adding approximately 0.8 percentage points to core Personal Consumption Expenditures (PCE) inflation.16 The Yale Budget Lab’s effective tariff rate stood at 11.8% as of April 2026 — the highest since 1943.17 The picture was further complicated by the Supreme Court’s 6-3 ruling on February 20, 2026, which struck down tariffs imposed under the International Emergency Economic Powers Act (IEEPA), prompting reimposition under Section 122 of the Trade Act of 1974.18
Corridor Inflation Comparison
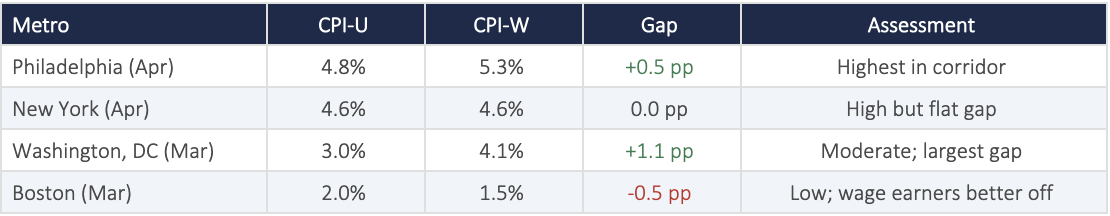
Philadelphia’s CPI-U of 4.8% exceeds every corridor peer. But the metro also runs structurally hotter than the national average (3.8%),19 reflecting sticky local shelter costs and household furnishings inflation. The CPI-W — the Consumer Price Index for Urban Wage Earners and Clerical Workers, which gives heavier weight to food, energy, and transportation — reached an estimated 5.3%, meaning that working-class households face a more acute squeeze.
Boston’s dramatically lower CPI (2.0%) suggests that energy-shock exposure varies by metro, likely reflecting differences in energy mix, housing dynamics, and local competitive structure. The takeaway for Philadelphia: the metro’s inflation is partly a corridor-wide energy event and partly a local structural premium, and both components would need to moderate for the headline to decline.
Philadelphia Fed President Anna Paulson’s rhetoric has shifted over the period. In January she expressed “cautious optimism” and saw no evidence of tariff-induced broader inflation.20 By May 19 she stated that inflation was “too high” even before the Middle East conflict.21
4. The Stagflation Question
Philadelphia’s combination of near-zero payroll growth and the corridor’s highest inflation raises the question of whether the metro is experiencing a form of stagflation. The answer depends on how much weight one places on the transience of the energy shock versus the persistence of the structural headwinds.
Real Wages: The Squeeze Is Confirmed
Nationally, BLS data for April 2026 show real average hourly earnings (AHE) fell 0.3% YoY, with nominal AHE at $37.41 (+3.6%).22 Philadelphia does not have a metro-specific real wage series, but combining the metro’s 4.8% CPI-U with estimated nominal wage growth of roughly 3.6% implies a real wage decline of approximately 1.2% — roughly four times the national hit.23
National Labor Market Signals: Weakening Beneath the Headline
The national household survey data suggest the labor market is softer than the 4.3% headline unemployment rate indicates.24 Involuntary part-time employment surged 445,000 in April to 4.9 million. The Job Openings and Labor Turnover Survey (JOLTS) shows hires dropped 419,000 to 5.1 million, while the quits rate — a measure of worker confidence — held at 2.0%, its lowest since January 2014.25 Claudia Sahm has argued that benchmark revisions may have overstated 2025 job creation by as many as 898,000 positions.26 Economists describe this as a “low-hire, low-fire” labor market: employers are not laying off in large numbers, but they are not hiring either.27
What Analysts Are Saying
Moody’s chief economist Mark Zandi has placed recession probability at 42–49%, noting that his “Vicious Cycle Index” triggered in early 2026.2829 The Stanford Institute for Economic Policy Research (SIEPR) stated in January that “the stagflation risk is real.”30 Locally, Joel Naroff (Naroff Economic Advisors) warned in December 2025 that a downturn “cannot be ruled out.”31
On the other side, Goldman Sachs forecasts 2.0–2.5% U.S. growth with tariff passthrough fading by mid-2026,32 and Morgan Stanley projects core PCE at 2.6% by year-end.33 RSM’s Joe Brusuelas characterizes the labor market as “remarkably stable.”34 The intellectual core of this view is that tariffs and energy shocks are one-time level shifts, not persistent inflation.
The Federal Open Market Committee (FOMC) itself is split. The April 29, 2026 vote was 8-4 — the largest dissent since October 1992 — with the federal funds rate held at 3.50–3.75%.3536 The Philadelphia Fed’s Survey of Professional Forecasters (Q2 2026) revised Q2 headline CPI expectations to 6.0% and cut 2026 GDP growth to 2.2%.37
For Philadelphia specifically, the most honest assessment is that the metro’s stagflationary signature is largely imported — energy via Iran, goods prices via tariffs, federal-sector spillover via DC — rather than locally generated. Whether it resolves as a transient shock or deepens into a sustained condition depends on policy variables the metro does not control.
Conclusion: Philadelphia’s Imported Squeeze
Philadelphia is not yet in a recession, but the region is clearly losing momentum. Payroll growth has slowed to near zero, most major sectors are flat or contracting, and the metro now has the highest inflation rate among its Northeast Corridor peers. This is not a classic local downturn. It is an imported squeeze: global energy prices, tariff passthrough, federal workforce reductions, and national policy uncertainty are showing up in Philadelphia through higher household costs, weaker hiring, and growing institutional exposure.
The region’s strongest employment engine remains Education and Health Services, but that strength also reveals a vulnerability. Philadelphia’s economy is increasingly dependent on one sector to offset weakness elsewhere. If Professional and Business Services sustains its April rebound, the metro may regain a second source of growth. But if that rebound fades, and if Medicaid cuts, research-funding uncertainty, or hospital margin pressure begin to affect the healthcare and university ecosystem, Philadelphia’s slow-growth pattern could become more durable.
The central question is whether the current squeeze is temporary or structural. If energy prices ease, inflation moderates, and healthcare hiring remains steady, the region may avoid a deeper slowdown. But if prices stay elevated while hiring remains weak, the practical effect for households will be clear: paychecks will stretch less far, job mobility will decline, and affordability pressures will intensify, especially for wage earners and lower-income households.
For regional leaders, the task is not only to interpret the latest data, but to watch the signals that arrive before the official numbers confirm a downturn. Initial unemployment claims, WARN notices, job postings, wage tax receipts, hospital margins, Medicaid enrollment churn, port volumes, building permits, and federal contract activity should serve as Philadelphia’s early-warning dashboard. These indicators will show whether the current weakness is stabilizing — or spreading.
Philadelphia cannot control many of the shocks now shaping its economic outlook. But it can track them earlier, understand where exposure is concentrated, and respond before slow growth becomes a broader affordability and employment crisis.
Methodology and Disclaimers
All Philadelphia MSA labor data from BLS Economy at a Glance (LAUMT42 and SMU42 series), not seasonally adjusted. National household data from BLS Employment Situation Summary Table A, seasonally adjusted. CPI data are bimonthly for the Philadelphia-Camden-Wilmington area. Corridor peer data from BLS Economy at a Glance for the respective MSAs. April 2026 metro data are preliminary. November and December 2025 data were revised May 19, 2026. Research sources cited via footnotes. This analysis is for informational purposes only and does not constitute investment, policy, or financial advice.
References
- BLS Economy at a Glance, Philadelphia-Camden-Wilmington MSA, Nov 2025–Apr 2026. All metro labor data not seasonally adjusted; April 2026 preliminary.
- KiTalent (2026), ‘Philadelphia’s Academic Medical Centers Are Spending $2.3 Billion.’
- The Daily Pennsylvanian (Feb 2026), ‘CHOP expands pediatric care facilities with $125 million donation.’
- Pew Research (Mar 13, 2026), ‘Federal workforce shrank 10% in Trump’s first year back in office.’
- Fortune (Mar 31, 2026), ‘The federal government shed 385,000 employees last year.’
- The Hill (2025), ‘Booz Allen to cut 2.5K jobs amid federal spending crackdown.’ Civilian-agency revenue −10.2% YoY.
- Yahoo Finance (2025), ‘Deloitte planning layoffs after federal crackdown on consulting contracts.’ 129+ contracts terminated, ~$371.8M.
- Philadelphia Inquirer (Apr 7, 2026), ‘The Philadelphia area lost thousands of federal jobs last year.’ OPM data: 3,906 jobs lost (−16.7%), Jan 2025–Feb 2026.
- WHYY (2025), ‘First glimpse of federal job losses shows hundreds out of work in Philly metro.’ IRS Philadelphia RIF notice.
- NYC Comptroller Mark Levine, ‘What Is Going on with NYC Jobs?’ (2026). No net job creation outside Health & Social Assistance in 2025.
- Foreign Policy (May 21, 2026), ‘Trump’s War on Tourism.’ International visitors fell ~5.5% in 2025.
- Hotel Dive (Nov 2025), ‘US hotel occupancy fell for 9th consecutive month.’ First non-recessionary annual RevPAR decline ever.
- BLS Release 26-752-PHI (May 12, 2026), Consumer Price Index, Philadelphia-Camden-Wilmington — April 2026. Energy +21.6% YoY, core 3.8%, shelter 3.4%, food 3.1%.
- Congress.gov CRS Report R45281 (Mar 11, 2026), ‘Iran Conflict and the Strait of Hormuz.’ U.S.-Israeli military operations began Feb 28, 2026.
- CNBC (Apr 21, 2026), ‘A timeline of how the Iran war shook oil prices.’ Brent from ~$72 to nearly $120 at peak; Strait of Hormuz effectively closed from March 4.
- Goldman Sachs via TheStreet (May 2026), tariff passthrough estimated at 72% after 12 months, adding ~0.8pp to core PCE.
- Yale Budget Lab, ‘State of U.S. Tariffs: April 8, 2026.’ Effective tariff rate 11.8%, highest since 1943.
- Holland & Knight / Ropes & Gray (Feb 2026), Supreme Court strikes down IEEPA tariffs 6-3 on Feb 20, 2026; Trump reimposed via Section 122 effective Feb 24.
- BLS Consumer Price Index Summary, April 2026 (national). CPI-U 3.8% YoY, core CPI-U 2.8%.
- Paulson, A., ‘Economic Trends and Opportunities for Philadelphia,’ Philadelphia Fed speech (Jan 14, 2026).
- Paulson, A., ‘Navigating Uncertainty,’ Atlanta Fed Financial Markets Conference (May 19, 2026).
- BLS Real Earnings Summary, April 2026. Real AHE −0.3% YoY; nominal AHE +3.6% ($37.41).
- BLS Philadelphia Area Economic Summary; QCEW Q3 2025. Average weekly wage $1,480.
- BLS Employment Situation Summary Table A (seasonally adjusted), April 2026.
- BLS JOLTS Summary, April 2026. Hires dropped 419K to 5.1M; quits rate 2.0%, lowest since Jan 2014.
- Claudia Sahm, ‘A Year With No Jobs—But No Recession,’ Substack (Feb 10, 2026). Benchmark revisions removed 898K jobs from 2025.
- CNN (May 8, 2026), ‘April hiring beat expectations, but economists warn the labor market is frozen.’ Diane Swonk: “suspended animation.”
- Fortune (May 6, 2026), Mark Zandi: ‘tariffs have done significant damage’; recession odds 42–48.6%.
- Axios (Apr 8, 2026), ‘A new recession red flag: the Vicious Cycle Index.’
- Stanford SIEPR (Jan 2026), ‘The U.S. economy in 2026: What to watch for.’ States: ‘The stagflation risk is real.’
- Philadelphia Inquirer (Dec 2025), Joel Naroff: ‘a downturn cannot be ruled out… we could start seeing [layoffs] by mid-2026.’
- Goldman Sachs (Jan Hatzius), ‘The Outlook for Fed Rate Cuts in 2026.’ Base case 2.0–2.5% growth.
- Morgan Stanley (Seth Carpenter), ‘Global Economic Outlook 2026.’ Core PCE 2.6% end-2026.
- RSM / Joe Brusuelas (May 2026), ‘In April jobs report, a solid, steady and stable labor market.’
- CNBC (Apr 29, 2026), ‘Fed interest rate decision April 2026.’ FOMC vote 8-4, largest dissent since Oct 1992.
- Trading Economics, ‘United States Fed Funds Interest Rate.’ Rate held at 3.50–3.75%; Miran dissented for cut; Hammack, Kashkari, Logan dissented against easing bias.
- Philadelphia Fed Survey of Professional Forecasters Q2 2026 (May 15). Q2 CPI revised to 6.0%; GDP cut to 2.2%; Anxious Index rose to 25.1%.


