12. Macro Indicators: Who’s Working in Philadelphia? A Look at Employment Gains by Disability Status Since 2010
This Leading Indicators extends our previous demographic analysis of Philadelphia's employment transformation, which examined workforce participation patterns across age groups, educational attainment, race, and gender from 2010 to 2023. The previous analysis revealed notable transformations in this period: a 72.5% increase in youth employment (ages 16–19), a dramatic 58.2% increase among workers with less than a high school education, strong growth among Hispanic/Latino workers with a 34.5% increase, substantial gains in employment for both men (from 59.6% to 75.2%) and women (from 59% to 72.6%), and increased median salaries for women by 54% (from $65,041 to $100,106) that outpaced the 38.5% growth for men (from $93,849 to $129,996), yet with a widening gender gap in 2023 of 2.6 percentage points by 2023.
Building on those findings, this edition of the Leading Indicators expands the demographic lens to examine employment patterns across Disability over the same 2010–2023 period. By benchmarking against peer cities—Chicago, Detroit, and Pittsburgh—we assess whether Philadelphia’s employment growth, marked by the addition of 379,200 jobs between 2010 and 2023, has been equitable – allowing for similar measurable gains across disability status. In other words, has the economic expansion in Philadelphia fostered equitable workforce participation for people with disabilities?
What You Need to Know
A report from the Pew Charitable Trusts reveals that the City of Philadelphia has the highest disability rate among major U.S. cities at 16% (approximately 246,000 people), with a strong correlation to poverty—22% of the city's poor are individuals with disabilities (see Figure 1).
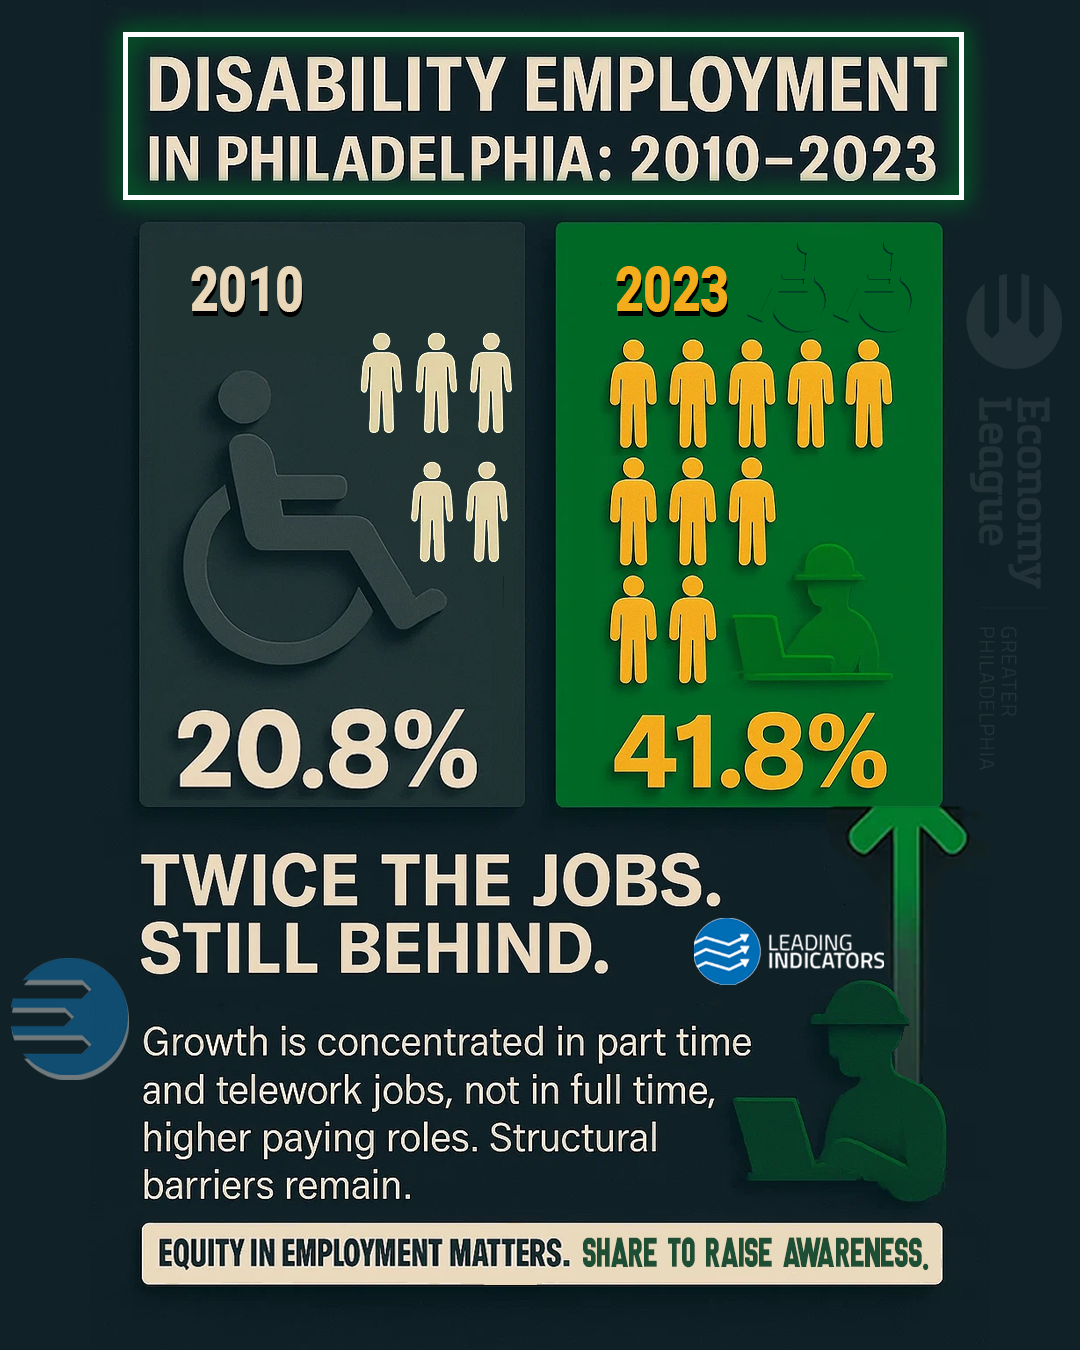
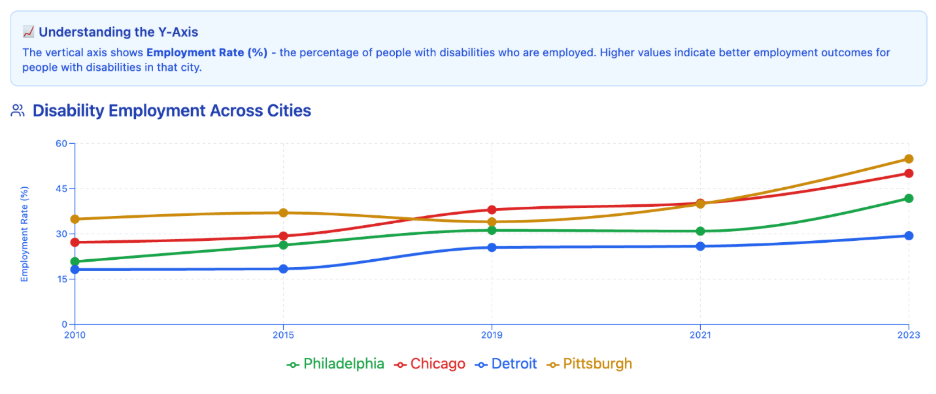
By 2023, Philadelphia demonstrated a 101% increase in the employment rate of people with disabilities—from 20.8% to 41.8%—achieving the highest relative improvement among all four peer cities, while ranking third in absolute employment numbers.
- Chicago: 84% growth (27.2% → 50.1%).
- Detroit: 61% growth (18.2% → 29.4%).
- Pittsburgh: 57% growth (34.9% → 54.9%).
The increased employment of people with disabilities in Philadelphia is a result of multiple factors including disability employment support systems operated by state agencies like Pennsylvania Office of Vocational Rehabilitation (OVR), the implementation of Americans with Disabilities Act (ADA), established organizations like The Arc of Philadelphia and SpArc Services, institutional employer programs like Children's Hospital of Philadelphia (CHOP)'s Career Path Program, and technological enablement through remote work options and assistive technologies accelerated by pandemic-driven workplace flexibility.
Disability Employment Transformation
In this LI, the metric we primarily look at is the “employment rate” from the American Community Survey, understood as the Employment-to-Population Ratio. This ratio represents the percentage of the selected population that is currently employed among all surveyed Americans aged 16 and older.
Overall Trends
The most remarkable development across all demographic groups analyzed in our previous Philadelphia Employment Transformation series occurred among individuals with disabilities, whose employment rate more than doubled in Philadelphia from 20.8% in 2010 (approx. 27,473) to 41.8% in 2023 (approx. 63,369) — a 101% increase representing 21 percentage points of improvement.
From 2010 to 2023, Philadelphia's dramatic growth rate leads all peer cities in relative improvement, significantly outpacing Chicago's 84% growth (from 27.2% to 50.1%), Pittsburgh's 57% growth (from 34.9% to 54.9%), and Detroit's 61% growth (from 18.2% to 29.4%). However, in absolute terms, Philadelphia's 2023 rate of 41.8% trails both Pittsburgh (54.9%) and Chicago (50.1%), while substantially exceeding Detroit (29.4%). Pittsburgh started with the strongest foundation in 2010 at 34.9% and maintained its leadership through 2023. Chicago demonstrated consistent, steady progress from a mid-range starting point, while Detroit, despite achieving solid relative growth, continues to lag significantly behind other peer cities in absolute disability employment rates.
| City | 2010 (%) | 2023 (%) | Relative Growth |
|---|---|---|---|
| Philadelphia | 20.8 | 41.8 | +101% |
| Chicago | 27.2 | 50.1 | +84% |
| Pittsburgh | 34.9 | 54.9 | +57% |
| Detroit | 18.2 | 29.4 | +61% |
Full Disability-based Employment Transformation Dashboard
Causes & Implications
Philadelphia's remarkable relative improvement most likely reflects the outcomes of disability employment support systems that have matured significantly over the past decade. Policy initiatives assessment suggests successful implementation of disability employment programs, Americans with Disabilities Act (ADA) compliance improvements, and targeted workforce development through established organizations like The Arc of Philadelphia and SpArc Services, which has provided customized employment programs since 1990. It is critical to note that Labour Economics shows that while the ADA did not significantly improve the transition rate from non-employment to employment, it did reduce the annual transition rate from employment to non-employment among people with disabilities by 3.5 to 4.3 percentage points (from 26.8% to 21.8%). In other words, though it remains a challenge for ADA to overcome initial hiring barriers that may persist due to employer misconceptions or biases, the anti-discrimination protections of ADA did prove effective at helping workers with disabilities retain their jobs once hired through workplace accommodations and legal protections.
Employer program impacts are also significant, advocating for successful public–private partnerships and disability hiring initiatives. The Pennsylvania Office of Vocational Rehabilitation (OVR) has played a crucial role as the state agency helping individuals with disabilities prepare for, obtain, and maintain employment. In 2024, OVR served 74,000 individuals with disabilities—over 21,000 of whom were students—and successfully placed more than 6,000 individuals into competitive, integrated employment opportunities. Students with disabilities are eligible to begin receiving OVR's pre-employment transition services at the age of 14. One of its flagship programs, the Summer Academy for Students Who are Blind or Visually Impaired, offers targeted interventions that prepare individuals for competitive employment pathways. Since 2009, the program has provided 325 students with a free, intensive 10-day training in independent living skills, assistive technology, workplace self-advocacy, and college preparation through immersive campus experiences. The program aims to build the confidence and practical capabilities essential for youth with disabilities to succeed in post-secondary education and competitive employment. In Governor Josh Shapiro’s Proposed 2025–26 Budget, a $5 million investment is allocated to the OVR to sustain its vital employment services—underscoring Pennsylvania’s continued commitment to making support systems for individuals with disabilities a top priority.
The presence of institutional employers like Children's Hospital of Philadelphia (CHOP), which operates its own Career Path employment services program, illustrates how major healthcare and educational institutions have integrated disability employment directly into their organizational structures. Since 2007, CHOP’s Career Path Program has provided supported employment services from vocational readiness assessment, career counseling, interview/resume coaching, to internship placement for skills training.
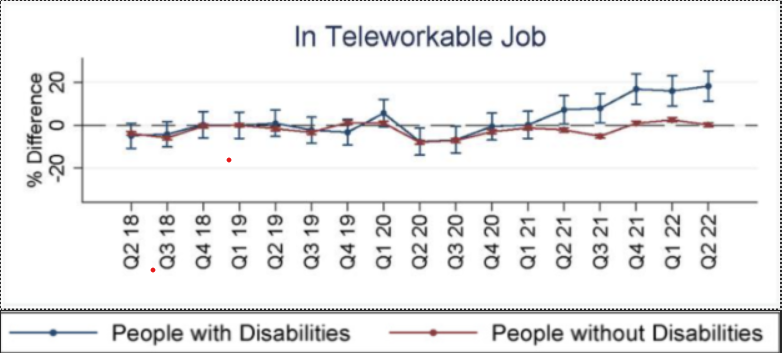
Technological enablement factors likely contributed through remote work options, assistive technologies, and digital accommodation tools that expanded employment opportunities, particularly accelerated by pandemic-driven workplace flexibility adoption. A research in the Disability and Health Journal revealed that, as seen in Figure 2, people with disabilities experienced much faster employment growth in teleworkable professions than non-disabled people did, beginning in Q2 2021 and increasing through Q2 2022, by which time the employment of people with disabilities had outpaced that of non-disabled people by approximately 18.6%.The growth in remote-capable positions has fundamentally altered employment accessibility for individuals with mobility, transportation, or other barriers that previously limited workplace participation.
U.S. Bureau of Labor Statistics Effects of COVID-19 pandemic on the employment situation news release and data. 2022. Remaining barriers still exist, as the 41.8% rate indicates substantial room for continued progress. Possible persistent challenges could include employer misconceptions about capabilities, inadequate accommodation provision, transportation difficulties, and benefit cliff effects where employment may jeopardize essential disability benefits. Research from the Job Accommodation Network reveals that employers continue to hold misconceptions about workers with disabilities. Concerns about the cost of providing reasonable accommodations remain a top barrier, despite evidence showing that 50.5% of reported accommodations cost employers nothing to implement, while the rest typically cost around $600.
Practices conducted by peer cities may suggest actionable approaches for continued improvement. The City of Chicago established initiatives like the Business Enterprises Owned by People with Disabilities (BEPD) Program to help expand economic opportunities for people with disabilities. This certification-aimed program encourages the participation of disability-owned small businesses in City contracts, allowing them to compete for bid opportunities. Pittsburgh Mercy–Employment Services helps individuals with intellectual and developmental disabilities prepare for, obtain, and maintain competitive jobs in the community. The program offers personalized services including job readiness training, résumé and interview support, job matching, on-the-job coaching, mobility training, and continuous follow-up to ensure long-term success and independence.
Conclusion
Philadelphia's employment data from 2010 to 2023 shows increases among people with disabilities, with disability employment doubling from 20.8% to 41.8%. However, employment disparities persist, with disability employment remaining substantially below the general population rate. They raise important questions about job quality and economic mobility: are workers with disabilities gaining access to positions with living wages, benefits, and career advancement opportunities, or are they concentrated in sectors with limited economic security and upward mobility potential? The substantial gains in disability employment may reflect expansion in entry-level or part-time positions concentrated in teleworkable jobs rather than broad-based access to full-time, well-compensated employment across industries. The data indicates that while economic expansion during this period benefited people with disabilities, underlying structural factors affecting both employment access and job quality for workers with disabilities remain.
Citations
- https://pmc.ncbi.nlm.nih.gov/articles/PMC9747687/
- https://askjan.org/topics/costs.cfm?csSearch=2546498_1
- https://dsq-sds.org/index.php/dsq/article/view/623/800
- https://www.bls.gov/covid19/effects-of-covid-19-pandemic-and-response-o…
- https://pmc.ncbi.nlm.nih.gov/articles/PMC6284816/
- https://www.pew.org/en/research-and-analysis/articles/2018/07/17/disabi…
- https://www.pachamber.org/media/1542/pa_chamber_elic_center_for_rural_p…
- https://www.pacca.org/state_policy_budget_issues.php
- https://www.pa.gov/agencies/dli/newsroom/secretary-walker-visits-l-i-su…
- https://papsa-web.org/shapiro-administration-hosts-roundtable-on-creati…
- https://www.pa.gov/content/dam/copapwp-pagov/en/budget/documents/public…
- https://www.chicago.gov/city/en/depts/dps/provdrs/cert/svcs/business_en…
- https://www.pittsburghmercy.org/intellectual-disabilities/employment-se…