Counting what stays: Philadelphia’s World Cup economy

Counting what stays: Philadelphia’s World Cup economy
The tournament will fill the city’s bars and trains for six match-days. How much of that activity becomes lasting local income, and how widely it is shared, is a question Philadelphia is well placed to measure as it happens.
ON THE NIGHT of June 14th, 18,806 people boarded the Broad Street Line at NRG station after Philadelphia’s first World Cup match, a flow comparable to a sold-out Eagles game. [1] The bars along Broad Street were busy. The FIFA Fan Festival on Lemon Hill drew more than 100,000 visitors in four days, and the airport projected 438,000 passengers over five days. [1] By the visible measures, the opening week went well. The measures that are harder to see are the ones this briefing is about. How much of the activity is new income that stays in Philadelphia? Who does it reach? And what does it cost the residents nearest to it?
The official projection is $770m in statewide economic impact, 6,615 jobs and $51m in state tax revenue. [2] The estimate was designed primarily to help the region size the opportunity, support its bid, and frame the public investment that followed. This briefing builds on that work with a narrower lens: the income that is retained locally and broadly shared. The aim is to give the city and its partners something they can track and act on while the tournament is still underway. Reconstructing the figure from the bottom up, with assumptions drawn from the sports-economics literature, points to net new local income on the order of $30m–$90m. That is a meaningful sum. It also reflects a long-studied distinction between gross activity and net local benefit, which are two related but different measures. The sections below set out how the estimate is built, where it is most uncertain, the conditions under which the return is larger, where the gains concentrate, and what the tournament asks of the residents nearest to it.
What you need to know
Five points anchor the analysis that follows.
- Gross activity is not net local benefit. The $770m projection measures statewide gross activity. A bottom-up reconstruction of the income that is genuinely new and retained in Philadelphia points to roughly $30m–$90m. It is a real gain, and a different measure serving a different purpose.
- Three forces shrink the local figure. Substitution (residents reshuffling local spending), crowding-out (displaced ordinary visitors), and leakage (revenue flowing to FIFA, rights holders, national chains and platforms) each reduce the share of headline spending that is new and stays local. Early lodging data, with about 80% of host-city hotels below forecast, are consistent with meaningful crowding-out.
- The benefit concentrates. Center City lodging and the South Philadelphia stadium district capture the largest retained shares. The 39-day Fan Festival at Lemon Hill is the most direct channel to local vendors, but it is gated and curated. Commercial corridors beyond this core gain little without deliberate effort.
- Who captures it is contested, not automatic. A late-night permit meant to spread late spending had cleared only 17 of 65 applicants by the eve of the tournament, and a hotel-workers’ contract covering about 4,000 employees remained unresolved into the tournament. Both will shape how widely the gains reach small operators and workers.
- Residents near the action bear real, measurable costs. Around Lemon Hill, the park is closed to the public for roughly six weeks, and rideshare is switched off within about six blocks during festival hours. The Parking Authority issued more than 3,100 tickets in the first five days. Philadelphia’s flat $2.90 transit fare and free post-match rides do spare residents the steep transport surcharges seen in some host cities, and organisers have committed $4m in lasting park improvements.
Economic-impact projections and realised outcomes tend to differ for three well-documented reasons, each of which reduces the share of headline spending that counts as new and local.
Substitution. When a Philadelphia resident spends at a World Cup watch-party, much of that outlay would otherwise have gone to other local businesses. The activity is real, but from the city’s perspective it is largely a transfer between venues rather than an addition to the total. Only spending by visitors from outside the region is a clear candidate for “new” money.
Crowding-out. Large events can displace the ordinary visitors and business travel they would otherwise have hosted, as higher prices, congestion and security measures deter regular demand. The early lodging data are consistent with this: the American Hotel & Lodging Association’s May survey found roughly 80% of host-city hotels tracking below initial forecasts, with Philadelphia among markets running behind a typical summer, and on June 10th the regional hotel association reported game-day rooms still available. [12] The 2006 World Cup in Germany showed a similar pattern, with strong visitor numbers but flat-to-lower hotel occupancy. [11]
Leakage. Some money spent in Philadelphia does not remain in the local economy. Under the standard Host City Agreement, FIFA and its entities are tax-exempt on broadcast and commercial-rights income, and match tickets are exempt from sales tax. Analyses of host-city contracts find that most organising costs fall to cities while their revenue collection is constrained. [18] Nationally-owned hotel chains and booking platforms capture a further share. These flows are inherent to how a tournament of this kind is structured, rather than signs of mismanagement.
These effects are also why the multiplier matters. Philadelphia’s impact sheet implies that initial spending is multiplied roughly four- to six-fold across the state economy. [2] For a single metropolitan area, the peer-reviewed literature generally regards local multipliers above about 1.5 as difficult to support once leakages are fully counted, and finds that the multipliers used in promotional studies are frequently around double what subsequent data bear out. [8–10] A higher figure is not necessarily an error, but it reflects a broader geography and a more generous set of assumptions than a city-level net estimate would use.
A transparent reconstruction
To make the assumptions explicit, the table below rebuilds the figure from the bottom up. It begins where the city’s own multiplier implies — a direct visitor-spending base of $128m–$193m, taken here at $160m — and then applies, in turn, the three adjustments above plus a credible local multiplier. [2] Each parameter is a range rather than a point, and each is explained beneath the table. The aim is an order of magnitude that others can interrogate and revise, not a precise forecast.
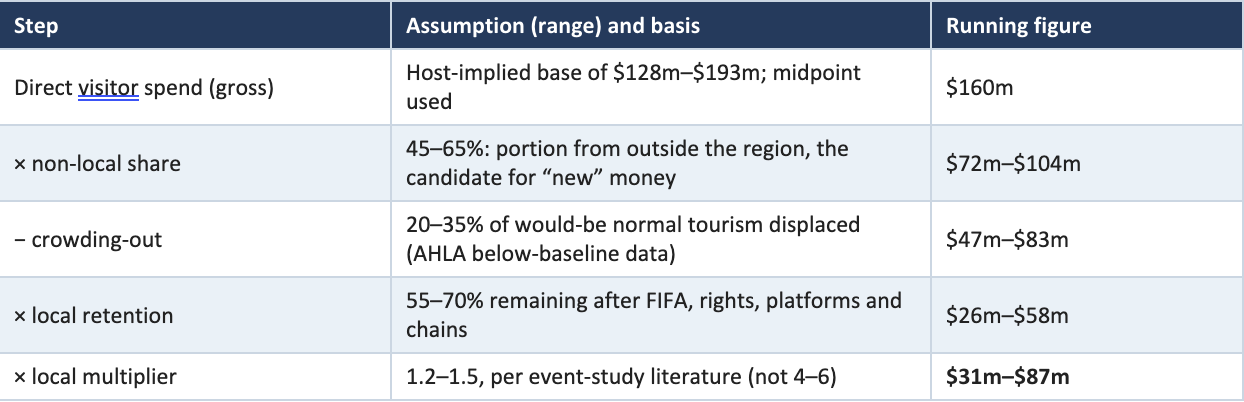
The reasoning behind each range is straightforward. The non-local share reflects that a substantial part of attendance is regional or local. Day-trippers and residents are spending money that is largely substituted, which leaves roughly half to two-thirds as genuinely imported demand. The crowding-out band is anchored to the observed shortfall in lodging against a normal summer. That shortfall implies a fifth to a third of the visitors the city might ordinarily host are being displaced. Retention captures the share of remaining spending that stays local after exempt and non-local channels take their portion. The range is wide because restaurant and small-business spending retains more locally than lodging or official channels. The local multiplier is set well below the host figure, in line with metropolitan estimates in the literature.
The estimate is sensitive to these choices, and reasonable analysts could shift it up or down. The non-local share and the multiplier move it most. What does not change across the plausible range is the broad order of magnitude. The reconstruction lands in the tens of millions, not the hundreds. Identifying that figure, and the assumptions behind it, gives the city a baseline it can refine with local data as the tournament generates it.
When the return is larger
The net figure is not fixed. It rises materially under conditions that some host regions meet and others do not, and setting those conditions out is more useful than a single verdict, because they are partly within a city’s control.
The return is likely to be largest at the state and regional scale, which is what the $770m figure measures. Visitor spending ripples through suppliers, wages and tax receipts well beyond the city line, and a statewide gross measure legitimately captures activity that a city-level net estimate excludes. The return is likely to be more durable where an event accelerates infrastructure, such as transit, public-realm or venue investment that would otherwise have taken years, so that the spending leaves behind an asset rather than only a weekend. Philadelphia’s permanent reopening of the South Broad Street concourse, closed for six years, is one such case. [1] And it is likely to reach more local firms where organisers deliberately route procurement and visibility toward them, rather than leaving distribution to proximity alone.
Two further returns sit outside the spreadsheet but are real. The intangible gains include international exposure, the operational experience of staging a global event, and the civic confidence a smooth opening week can build. They are genuine, if unquantified, and prudent analysis neither dismisses nor banks them. The legacy return is realised where temporary commitments are honoured. Organisers have pledged $4m in lasting improvements to Lemon Hill, a commitment the city can hold them to after the crowds leave. [16]
These conditions explain why a $770m figure and a $30m–$90m figure can both be accurate. They answer different questions at different scales. The estimate serves the city best when its scope is clear, sizing the statewide opportunity on one hand and tracking retained local benefit on the other, and when the conditions above are treated as levers to pull rather than outcomes to assume.
Where the benefit concentrates
The income that is retained does not spread evenly, and three distinct economies are taking shape. The stadium district in South Philadelphia receives six concentrated match-day surges. A large part of that spending, on tickets, concessions and official merchandise, moves through formal channels with limited circulation among nearby independent businesses. The Center City hotel-and-restaurant core captures the largest retained share. That gain is real, but it is partly relative, in that the district wins a larger slice of a market that crowding-out is keeping smaller than projected. [5, 12] The 39-day Fan Festival on Lemon Hill is the most direct vehicle for local inclusion. It is free to enter, with a marketplace for local vendors and a rotating roster of independent food trucks. But it is also gated, capacity-limited and curated, so businesses outside its perimeter benefit only insofar as visitors disperse into the surrounding neighbourhoods. Part of the spending it draws is genuinely induced, from residents who came out for the social energy rather than watching at home, and it flows to bars, vendors and tipped workers who might otherwise have seen nothing. From the city’s books this is largely a transfer rather than new money, since a resident’s bar tab replaces a quiet evening in. But the transfer has a direction worth tracking, because it moves spending toward hospitality and toward whichever corridors capture the crowd. The festival is the clearest proxy for it, and corridor card-spend and festival attendance are the indicators that would show it in real time. [4, 6]
One caveat sharpens that picture. The hotel figures exclude short-term rentals, and the two markets are moving in opposite directions. As of June 10th, Airbnb and Vrbo listings across the region were about 60% booked on game days and game-day eves, up from under half in early May, with bookings up 15% year-on-year. [23] Much of that demand is landing in neighbourhoods with few hotels, including Fishtown, Northern Liberties, Old City and University City, where Airbnb reports its fastest host growth. The fans visible in those corridors are, in large part, staying in rentals the hotel data never counts. Soft hotel numbers therefore reflect substitution into short-term rentals as much as absent visitors. The lodging is shifting channel rather than simply going unsold. Deloitte, in an analysis for Airbnb, estimated that roughly 149,000 of the tournament’s visitors would need overnight accommodation, about 17,000 of them through the platform. [24]
The commercial corridors beyond this core, which make up most of the city, are unlikely to see much benefit without deliberate effort, because visitor spending follows the path of least friction — toward where people sleep, arrive, or already intend to go. Reaching them requires the kind of programming, marketing and transit connection that has to be planned rather than assumed.
Distribution and execution
Two further factors shape how widely the gains are shared. The first is administrative access. The temporary “Philadelphia 250” permit was intended to let bars extend trading to 4am and capture late-night visitor spending. By the eve of the tournament it had cleared only 17 of 65 applicants. A statutory 30-day waiting period meant later applicants could not be approved in time for the opening matches, and several owners judged the fees and added insurance not worth the extension. [17] In practice, this tends to concentrate the opportunity among larger operators better equipped to navigate the process.
The second is labour, where the distributional question is sharpest because the workers staffing the event are not generally those who capture its margins. A rate premium can flow to profit, management fees or debt service before it reaches wages. This is the backdrop to an unresolved contract: Unite Here Local 274, representing about 4,000 workers, set a strike deadline at five Center City hotels for June 12th and extended it into the tournament without settlement, after 2025 negotiations had already raised housekeeper pay from $19 to about $30 an hour at some properties. [16] The eventual terms will determine labour’s share of the event, and the unresolved deadline is a live indicator of it. With immigrants holding about one in five of the city’s jobs and a disproportionate share of hospitality and back-of-house roles, [15] the available labour supply is also sensitive to enforcement conditions — a consideration for staffing as well as for policy.
What it costs the people who live here
Residents are not only an audience for the tournament. Near the venues they help pay for it, in time and access rather than ticket price. The clearest case is the Fan Festival’s footprint. Lemon Hill, a public park, is fenced and closed to ordinary use for roughly six weeks, and the local lanes of the Benjamin Franklin Parkway are shut to traffic from late May to early September to favour pedestrians and cyclists moving between Center City and the site. [19] Within about six blocks of the festival, Uber and Lyft are switched off during operating hours, a practice known as geofencing. Carless residents must walk to the edge of the zone to be picked up, or use SEPTA, though wheelchair-accessible rides are meant to be exempt. [20]
Enforcement falls on residents first. In the festival’s opening five days the Parking Authority issued more than 3,100 tickets in the surrounding blocks. It says fewer than 6% were in error and that it cancelled 181 issued to residents with valid permits. [19] Neighbours in Fairmount and Brewerytown have reported drivers rerouting and speeding down one-way side streets around the closures, prompting some to put up homemade traffic-calming signs. [19] These are concentrated, local costs that do not show up in any economic-impact figure, and they are borne disproportionately by households closest to the event.
For customers and residents citywide, the price picture is mixed, but by host-city standards it is comparatively mild. Lodging is the sharpest pressure. A consultancy tracking the 16 World Cup host cities found most posting year-on-year room-rate rises of at least 80%, and Philadelphia listings near the June 19th match were advertised from roughly $300 for two nights. [21] Where Philadelphia stands out is transport. Unlike the New York and Boston venues, where match-day transit has been priced at $100 or more per person and stadium parking runs into the hundreds, Philadelphia’s stadium sits inside the city on the Broad Street Line: the fare holds at the standard $2.90, and rides home after all six matches are free under a sponsor-funded arrangement. [22] That keeps the single largest match-day cost for residents close to an ordinary game-day, even as lodging and rideshare rise with demand.
Against these costs the city has set explicit commitments to residents. They include free temporary parking permits in the Lemon Hill zone and a $4m package of lasting park improvements, covering a new accessible path, playground, lighting and a rebuilt pavilion, that neighbours had sought for years. [16, 19] Whether those commitments are delivered after the tournament is itself one of the indicators worth tracking.
Much of the evidence needed to answer these questions is available now, and most of it is reported weekly. Tracking it during the tournament, rather than reconstructing it afterward, is what makes the difference between a retrospective and a usable signal. Four sets of indicators map onto the questions above. For new money: hotel occupancy and average rates against the same week last year, alongside short-term-rental pacing, both currently running below forecast. For geography: Broad Street Line and PHLASH ridership and card-spend by corridor, which show whether crowds disperse beyond the core. For local capture: the number and value of contracts and Fan-Festival vendor slots going to small, minority- and immigrant-owned firms, with the permit-clearance rate as a measure of administrative friction. And for workers: the Local 274 settlement terms, and whether the projected 6,615 jobs prove durable or largely temporary — FIFA’s own analysis assumes roughly 40% of event-related labour is short-term and below the average wage.
None of this is an argument against hosting. Philadelphia has shown it can move large crowds and stage a global event capably, and the reputational and civic returns, while hard to value, are real. The point is a constructive one. The benefit that stays in the city is more concentrated, and more contingent on deliberate effort, than the headline alone conveys. The levers that widen it, including vendor access, corridor programming, transit connection and the terms workers settle on, are still in play while the tournament runs. Whether the event leaves durable local value, in vendor relationships, corridor sales, measurable worker earnings and the habit of tracking who benefits, is what the attendance figures cannot show, and what is most worth following over the weeks ahead.
Sources
- [1]City of Philadelphia, opening-week release, June 16, 2026; SEPTA; PhillyVoice.
- [2]Philadelphia Soccer 2026 economic-impact one-sheet (ESI/Econsult); Axios Philadelphia, Nov. 2024.
- [4]FIFA/Philadelphia Soccer 2026 Fan Festival pages; Visit Philadelphia, June 2026.
- [5]Center City District, “State of Center City 2026.” ADR and room-night figures are author calculations.
- [6]Philadelphia Soccer 2026 Fan Festival and Vendor Opportunities pages.
- [8–10]Matheson, “Economic Multipliers and Mega-Event Analysis” (2009) and “The Economics of the World Cup” (2018); Baade & Matheson, Regional Studies (2004); What Works Growth on input-output multiplier overstatement (2022).
- [11]Baade & Matheson on 1994 World Cup host-city outcomes; Germany 2006 occupancy data.
- [12]AHLA host-city survey, May 2026 (via AirROI); The Philadelphia Inquirer, June 10, 2026; AirDNA.
- [15]The Pew Charitable Trusts, immigrant-workforce analyses, Sept. 2024.
- [16]Unite Here Local 274; WHYY/Inquirer coverage of the June 2026 strike deadline; Unite Here ICE-protection positions (Los Angeles, Seattle).
- [17]Act 8 of 2026 (“Philadelphia 250” permit); The Philadelphia Inquirer, June 10, 2026.
- [18]FIFA Host City Agreement tax analyses (Open Access Law; Institute on Taxation and Economic Policy); ProPublica/Houston Chronicle review.
- [19]WHYY and The Philadelphia Inquirer coverage of Lemon Hill road closures, residential parking and PPA ticketing, June 2026; City of Philadelphia / Office of Special Events Fan Festival access plan, May 2026.
- [20]The Philadelphia Inquirer and Billy Penn on rideshare geofencing around the Fan Festival, May–June 2026.
- [21]FCM Consulting host-city room-rate analysis (via Newsweek), June 2026; Al Jazeera on Philadelphia lodging listings, June 2026.
- [22]CBS Sports on host-city match-day transport pricing; City of Philadelphia and SEPTA World Cup transit plan (Airbnb-funded free rides home), June 2026.
- [23]AirDNA short-term-rental booking and occupancy data (via The Philadelphia Inquirer, June 10, 2026); Airbnb host-growth figures by neighbourhood, April 2026.
- [24]Deloitte analysis commissioned by Airbnb, December 2025 (visitor-accommodation and Airbnb-guest estimates for the Philadelphia metro).
Method: The reconstruction multiplies a host-implied direct-spend base by cited ranges for non-local share, crowding-out, local retention and a credible local multiplier. It is an order-of-magnitude estimate rather than a forecast; every parameter is adjustable, and the underlying ESI/Econsult model is not public.


