Know Your Price, Philadelphia, Part III: Housing Price & Demographic Change in the Neighborhoods
Know Your Price, Philadelphia:
Housing Price & Demographic Change in the Neighborhoods, Part III
 In our current Leading Indicator series, we are using our recent “Know Your Price Philadelphia” study as a lens to examine neighborhood demographic change from 1950 to present day. While the original report illustrates appreciation and devaluation of house prices in Philadelphia neighborhoods, this series provides an analysis of the accompanying demographic transformation in each area.
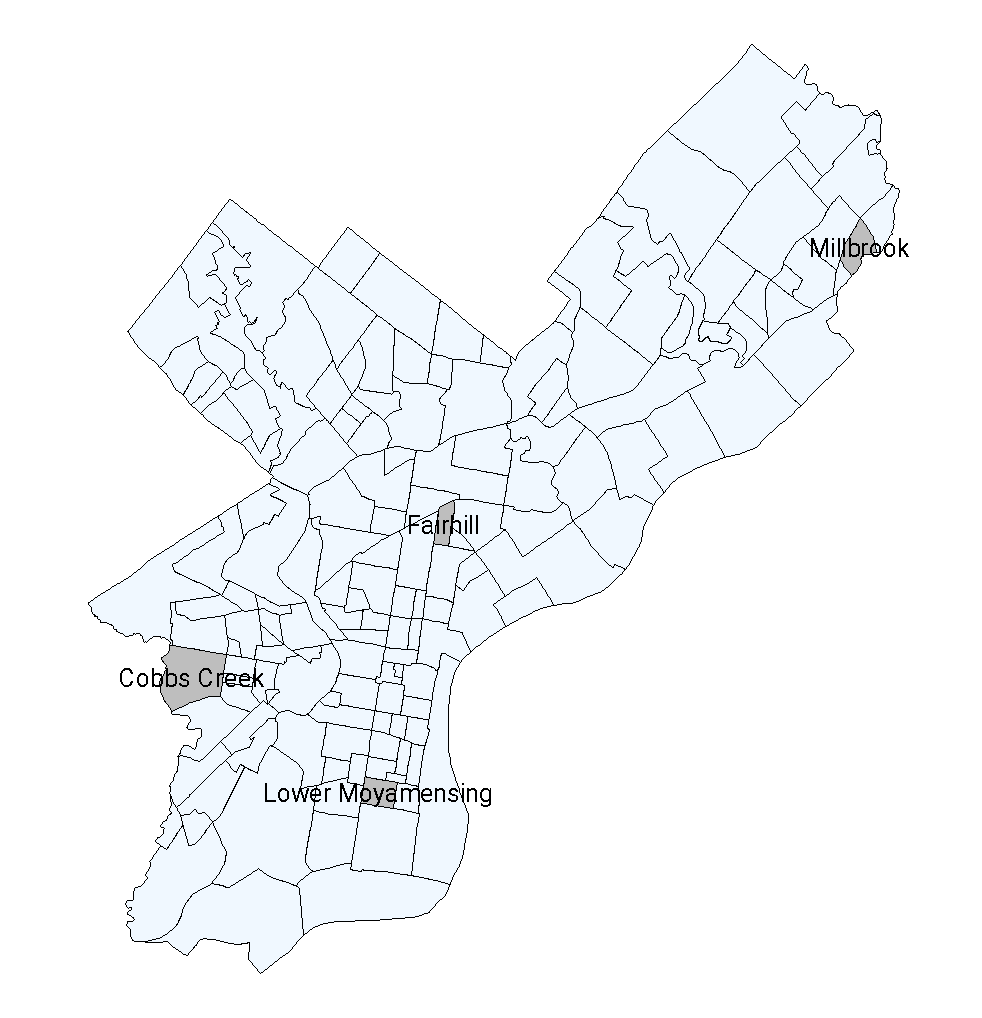
This third and final installment of the series examines four neighborhoods: Fairhill, Lower Moyamensing, Cobbs Creek, and Millbrook. Each of these neighborhoods has seen little to no property value appreciation since 1950. With that in mind, we consider the decade-by-decade population changes that may have hindered property value growth.
What You Need To Know
Northeast: Millbrook
Millbrook is in the 10th City Council District, in Northeast Philadelphia. This neighborhood saw an explosion in population from 1950-1970, increasing fifty-fold. It reached its maximum population in 1980, at which point the neighborhood was 97% white. While the total population has been slowly declining since then, the demographic makeup has stayed relatively stable. As of 2020, the neighborhood is 81% white, while Asian, Black, and Latino groups each make up less than 10%.
Figure 1:
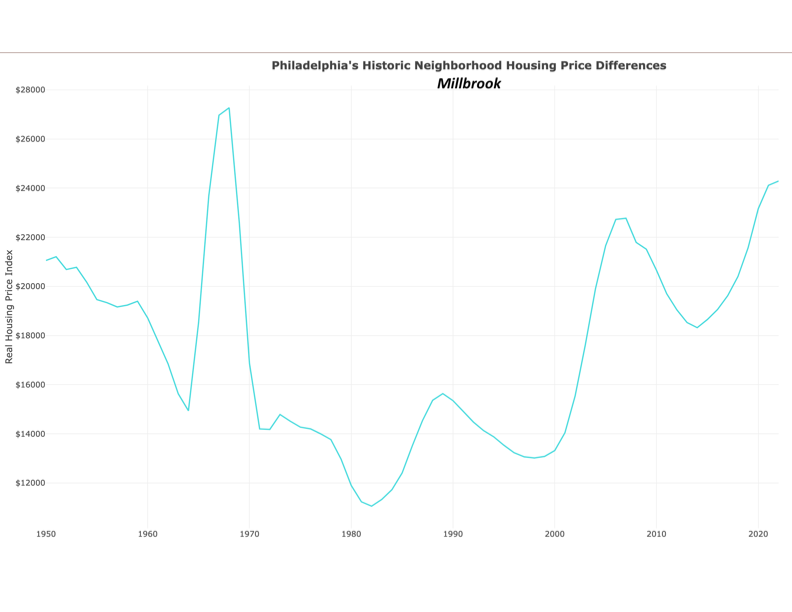
Millbrook’s property values nearly doubled between 1964 and 1968, aligned with the rapid influx of residents to the neighborhood. However, this was followed by an immediate drop in value, which fell to its absolute low in 1982. Since then, prices have been trending upwards. The 2022 housing price index is below the 1968 maximum but surpasses the 1950 value.
Figure 2:

Southeast: Lower Moyamensing
Lower Moyamensing sits just east of Broad Street in Southeast Philadelphia, in the 1st City Council District. Lower Moyamensing experienced overall population decline each decade from 1950-2010. This decline was primarily driven by a declining white population, which fell by more than 60% during those sixty years. The small Black population has stayed relatively stable in size, with only small fluctuations over the given period. The Asian and Latino groups have both been increasing since their appearance in the Census in 1970. As of 2020, the neighborhood’s total population has seen an uptick, growing by 16% over 2010. The white population now makes up 44% of the neighborhood, followed by Asians at 26%, and Latinos at 20%.
Figure 3:
Property values in Lower Moyamensing fell sharply between 1950 and 1961, partially recovered by 1966, and then fell again until 1971. House prices saw some marginal fluctuation over the next twenty-five years, eventually reaching their ultimate minimum of the study in 1997. Since then, prices have been trending upwards. As of 2021, the neighborhood’s house price index outpaced the 1966 peak, but hasn’t reached 1950 levels.
Figure 4:

North Philadelphia: Fairhill
Fairhill is situated on the east side of North Philadelphia in the 7th City Council District. While Fairhill’s total population in 2020 is only 5% larger than its 1950 population, the composition gas shifted markedly. A white-majority neighborhood from 1950 to 1980, the white population began its slow exodus from the neighborhood in 1970.
By 1990, Fairhill was a majority-BIPOC neighborhood, with Latinos and Asians making up 30% and 25% of the population, respectively. From 1990-2000, the Latino, Asian, and Black populations continued to grow, as the white population shrank to just 18% of the neighborhood. Between 2000 and 2010, Asian residents moved out and Latino residents became the majority group for the first time, making up 58% of the population. The 2020 demographics look similar to 2010, although the neighborhood’s total population decreased slightly.
Figure 5:
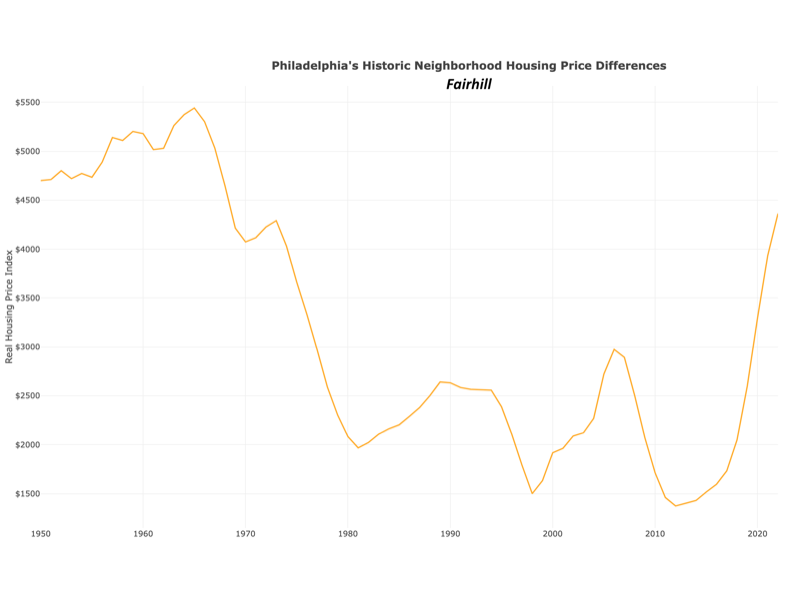
Housing prices in Fairhill reached their maximum in 1965 before beginning a sharp decrease that lasted through 1981. Then, after three decades of fluctuations, prices have been increasing steadily since 2012. As of 2022, the housing price index is on par with its 1973 value, but still 20% below the neighborhood’s 1965 maximum.
Figure 6:

West Philly: Cobbs Creek
Cobbs Creek is in West Philadelphia in the 3rd City Council District. This neighborhood has been predominantly Black since 1970, following the departure of 95% of the area’s white population between 1950-1970. The neighborhood maintained a Black majority of more than 92% from 1970-2010, although the Black population itself decreased by a quarter over this forty-year period, bringing down the neighborhood’s total population. As of 2020, the Black population fell to 85% of the neighborhood as the white, Latino, and multiracial groups grew in size.
Figure 7:
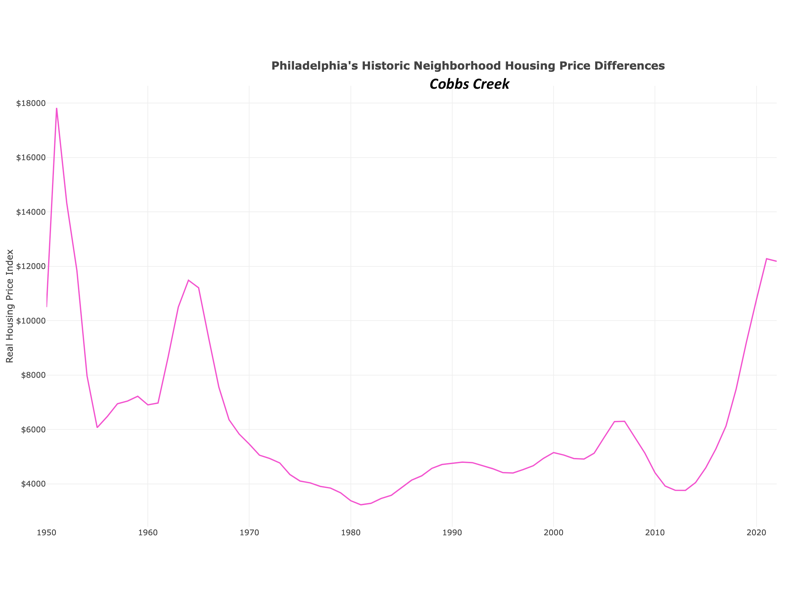
In Cobbs Creek, the housing price index reached its summit in 1951, then began an oscillating decline until 1981. However, prices have been steadily trending upwards since then, beginning a steep climb in 2013 that has persisted through the present day. As of 2021, prices had surpassed the 1964 peak but were still far below the 1951 maximum.
Figure 8:

Conclusion and Takeaways
In the final installment of this series, we examined four Philadelphia neighborhoods that experienced population loss or demographic transformation alongside stagnant or falling property values. In Cobbs Creek, the sharp decline in house prices aligns with the sudden departure of white residents. In Millbrook, prices quickly rose with an influx of residents and then plummeted just as quickly. Property values in Lower Moyamensing and Fairhill fell as the total population declined, but prices are on the rise as the decline of the white population gave way to an increasingly large BIPOC-majority community. In each of these neighborhoods, prices have been slowly trending upwards since the 1980s even as the population has been declining, yet none have recuperated their peak values from the 1950s or 1960s. This suggests that property values in these neighborhoods have yet to recover from the housing discrimination and white flight of the mid-20th century that drove down prices.