Leading Indicators: Philadelphia’s Affordability Margin Is Narrowing

By Saloni Tandon, Director of Research & Analytics
Edited by Jeff Hornstein, Executive Director
May 26, 2026
How faster regional inflation is reshaping household costs, wages, and competitiveness
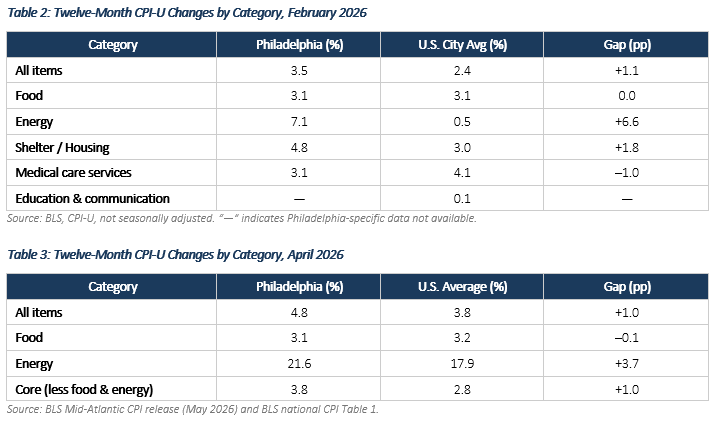
Consumer prices in the Philadelphia-Camden-Wilmington metropolitan area have been rising faster than the national average since 2023, marking a notable shift from the preceding decade. As of February 2026, the Philadelphia region’s Consumer Price Index for All Urban Consumers (CPI-U) recorded a twelve-month increase of 3.5 percent, compared with 2.4 percent for the U.S. city average—a gap of 1.1 percentage points. By April 2026, the most recent month for which Philadelphia-specific data are available, the regional rate had accelerated to 4.8 percent year-over-year, driven by a dramatic surge in energy costs, while the national rate stood at 3.8 percent.
This divergence carries significant implications for households, employers, and policymakers across the Greater Philadelphia region. The Philadelphia metropolitan area’s Bureau of Economic Analysis Regional Price Parity of 102.6 (U.S. = 100) means the region is already modestly above-average in overall price level. When inflation also runs above the national pace, the cumulative squeeze on household purchasing power intensifies—particularly for lower-income families. Within the city of Philadelphia, the Housing Initiative at Penn estimates that 52 percent of renters are cost-burdened, spending more than 30 percent of income on housing; the share is lower in suburban counties but rising.
This brief examines the trajectory of consumer prices in the Philadelphia area from 2016 through April 2026, benchmarks them against national trends across major spending categories, and identifies the forces placing the greatest pressure on household budgets.
A note on geography. Unless otherwise stated, "Philadelphia," "Philadelphia area," and "the region" refer throughout this report to the Philadelphia-Camden-Wilmington, PA-NJ-DE-MD metropolitan statistical area as defined by the U.S. Bureau of Labor Statistics — an eleven-county area spanning southeastern Pennsylvania, southern New Jersey, northern Delaware, and Cecil County, Maryland. This is the geographic unit for which the BLS publishes CPI data and the basis for all price and expenditure comparisons in this analysis. Where data refer specifically to the city of Philadelphia or to individual counties, that narrower geography is noted explicitly.
What you need to know
- Philadelphia’s inflation pattern has flipped. From 2016 to 2025, cumulative CPI growth in the Philadelphia area was 32.1 percent, slightly below the national increase of 34.2 percent. But since 2023, Philadelphia has consistently posted higher annual inflation than the U.S. average.
- The regional inflation gap widened in 2026. In February 2026, Philadelphia’s CPI rose 3.5 percent year-over-year, compared with 2.4 percent nationally. By April 2026, Philadelphia’s rate had accelerated to 4.8 percent, compared with 3.8 percent nationally.
- Energy is the sharpest source of divergence. Philadelphia-area energy prices rose 21.6 percent year-over-year in April 2026, compared with 17.9 percent nationally. In February, the regional energy gap had been even wider: 7.1 percent in Philadelphia versus 0.5 percent nationally.
- Housing remains the largest structural pressure. Housing accounts for 34.5 percent of Philadelphia-area household expenditures, and the regional housing CPI has risen 39.9 percent since 2016.
- Household costs exceed wage premiums. Philadelphia-area households spent an average of $92,234 annually in 2023–2024, compared with $77,907 nationally, an 18.4 percent premium. Average hourly wages in the region were only 2.5 percent higher than the national average.
- Transportation is the main cost advantage. Philadelphia-area households spend slightly less on transportation than the national average, likely reflecting the region’s transit infrastructure and relatively transit-oriented urban core.
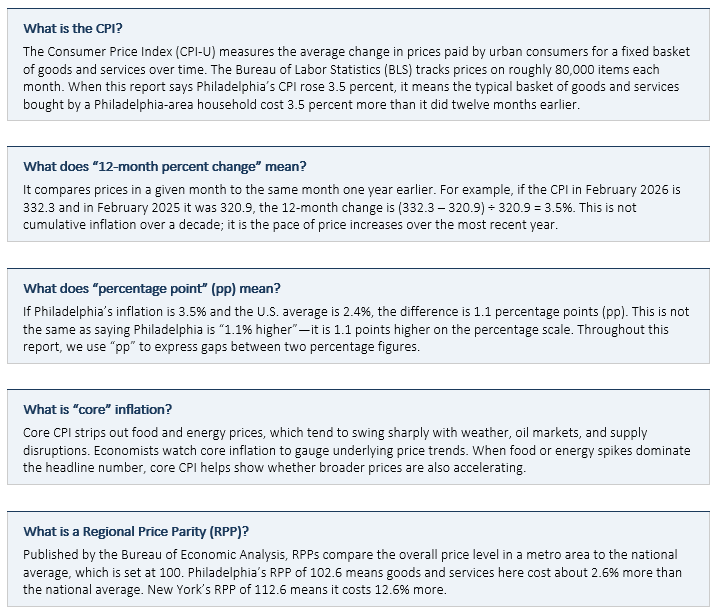
A Note for the Reader: How to Understand the Numbers in This Report
A Decade of Price Growth: 2016–2025
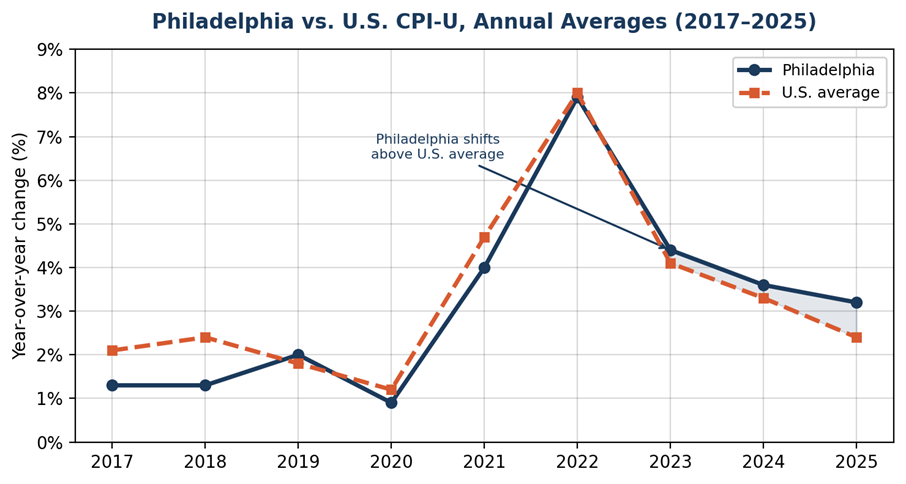
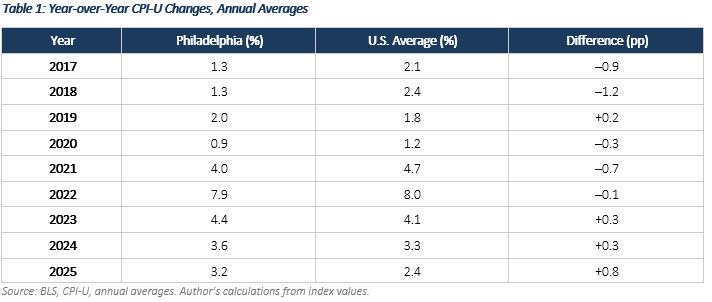
From 2016 through 2022, Philadelphia-area inflation ran at or below the national average — even through the pandemic-era surge, when the region tracked the U.S. closely but came in slightly lower (7.9 versus 8.0 percent in 2022). Cumulatively over 2016–2025, regional CPI growth of 32.1 percent still trails the national figure of 34.2 percent.
But the trajectory has reversed. Beginning in 2023, Philadelphia has outpaced the national average in every period measured — and the gap is widening: 0.3 percentage points in 2023, 0.8 points in 2025, and 1.1 points by February 2026. If sustained, this pace will erase the region's cumulative advantage within a few years.
Figure 1: Philadelphia vs. U.S. CPI-U, Annual Averages (2017–2025)
Source: BLS, CPI-U All Items, annual averages, not seasonally adjusted (Series CUURS12BSA0 for Philadelphia, CUSR0000SA0 for U.S.).
What Is Driving the Gap? A Category-by-Category Comparison
Comparing Philadelphia to the national average at the headline level tells only part of the story. The BLS publishes category-level CPI data that allows us to see precisely where the region is paying more—and, in some cases, less—than the rest of the country.
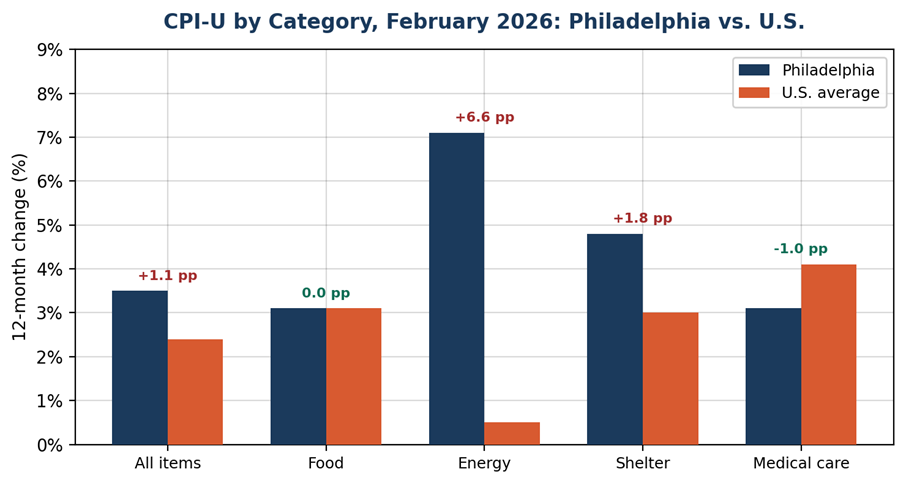
Figure 2: CPI-U by Category, February 2026
Source: BLS, CPI-U, not seasonally adjusted. Philadelphia from BLS Mid-Atlantic release; U.S. from national CPI tables.
Energy: The Widest Gap
Energy prices represent the most dramatic divergence. In February 2026, Philadelphia-area energy prices rose 7.1 percent year-over-year while the national energy CPI increased just 0.5 percent—a 6.6 percentage-point gap. By April 2026, energy had surged further: Philadelphia was up 21.6 percent year-over-year versus 17.9 percent nationally, still a 3.7-point premium. This reflects regional electricity rate structures, the Philadelphia area’s greater reliance on heating fuels during winter months, and the pass-through of volatile wholesale energy markets. Rising utility costs disproportionately affect lower-income households, for whom energy represents a larger share of total spending.
Shelter and Housing: Persistent Pressure
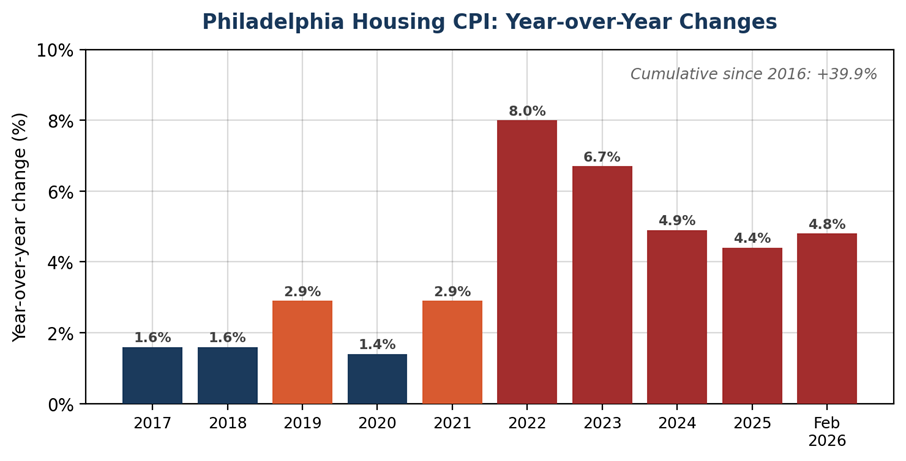
Housing is the largest component of the CPI basket, representing over a third of the Philadelphia household budget (34.5 percent of expenditures versus 33.2 percent nationally, according to the BLS Consumer Expenditure Survey). In February 2026, the Philadelphia-area housing CPI rose 4.8 percent year-over-year, compared with 3.0 percent for the national shelter index—a gap of 1.8 percentage points. Cumulatively, the Philadelphia housing index has climbed 39.9 percent since 2016, with particularly sharp increases in 2022 (8.0 percent) and 2023 (6.7 percent). The Housing Initiative at Penn reports that 52 percent of Philadelphia renters are cost-burdened.
Figure 3: Philadelphia Housing CPI, Year-over-Year Changes
Source: BLS Series CUURS12BSAH, Philadelphia Housing CPI, not seasonally adjusted. Author’s calculations.
Food: Converging with the National Average
Food prices present an evolving picture. In February 2026, the BLS summary reported Philadelphia-area food inflation at 3.1 percent, matching the national food CPI of 3.1 percent from the detailed BLS data series. By April 2026, Philadelphia food inflation remained at 3.1 percent while the national rate edged up to 3.2 percent. In other words, the food-price gap that existed earlier has essentially closed.
Medical Care: A Surprising Reversal
Philadelphia's large and competitive healthcare sector — home to multiple major health systems and academic medical centers — appears to be exerting a moderating effect on medical care inflation. The Philadelphia medical care index rose 3.1 percent in the twelve months through February 2026, while the national medical care services CPI rose 4.1 percent, placing the region 1.0 percentage point below the national rate.
Transportation: Volatile but Cumulative
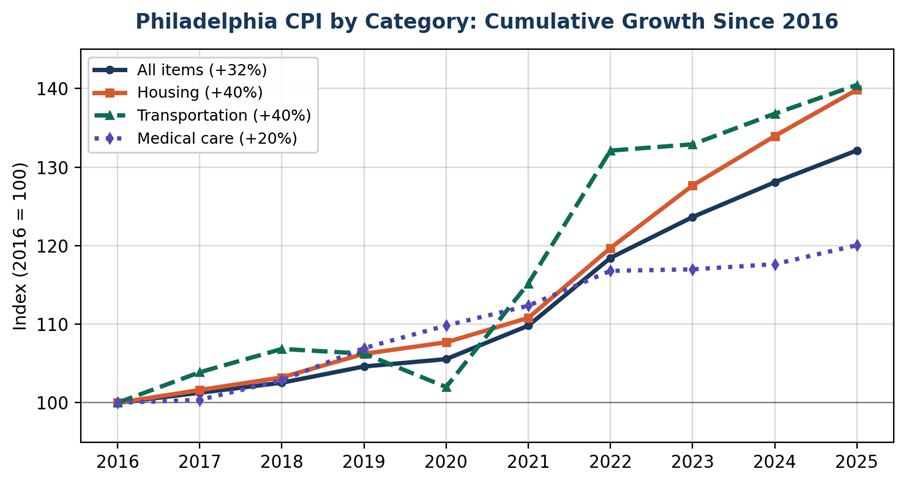
Transportation costs in the Philadelphia area have risen 40.5 percent cumulatively since 2016, with double-digit spikes in 2021–2022. In February 2026, regional transportation prices were up 2.4 percent year-over-year. Philadelphia-area households benefit from SEPTA and a relatively transit-oriented urban core: BLS data show the region devotes 14.1 percent of household budgets to transportation versus 17.0 percent nationally.
Tuition and Childcare: A Growing Burden
Tuition, school fees, and childcare have risen sharply. As of February 2026, this index stood at 1,261.7, reflecting a 5.5 percent year-over-year increase and an 18.8 percent cumulative rise since 2018 alone. National education and communication CPI growth, by comparison, was just 0.1 percent in February 2026. Federal childcare price data show that infant care in Philadelphia consumed about 22.5 percent of median household income in 2022.
Cumulative Price Growth by Category
Rebasing each Philadelphia CPI category to 100 in 2016 reveals the divergent paths of different cost components. Housing and transportation have each risen roughly 40 percent—substantially outpacing the 32 percent increase in the overall index. Medical care, despite its high absolute price level, has grown more slowly at about 20 percent over the period.
Figure 4: Philadelphia CPI by Category, Cumulative Growth Since 2016
Source: BLS CPI-U category indexes for Philadelphia, annual averages, rebased to 2016 = 100. Author’s calculations.
The Cost-of-Living Picture: Expenditures, Wages, and Purchasing Power
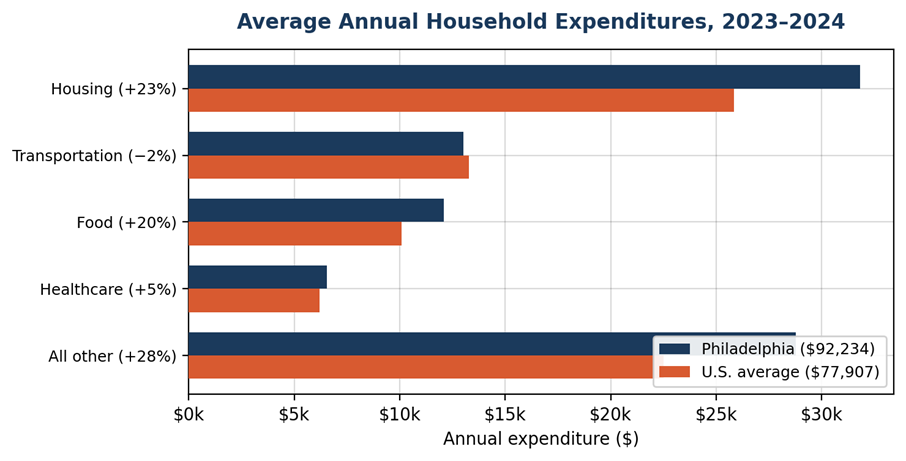
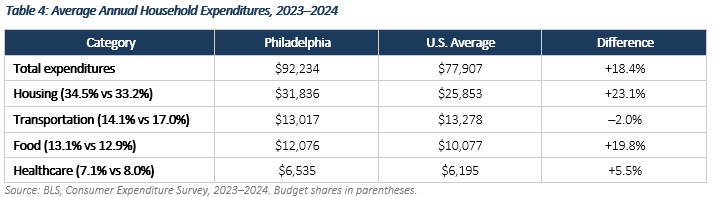
Consumer Expenditure Survey data for 2023–2024 underscore the breadth of the cost differential. Philadelphia-area households spent an average of $92,234 annually, compared with $77,907 nationally—an 18.4 percent premium. Housing accounts for the largest share of this gap: at $31,836 per year, Philadelphia residents spend 23.1 percent more on housing than the national average of $25,853. Transportation is the one major category where Philadelphia comes in below the national average, reflecting the region’s transit infrastructure.
Figure 5: Average Annual Household Expenditures, 2023–2024
Source: BLS, Consumer Expenditure Survey, 2023–2024. Metro-area figures.
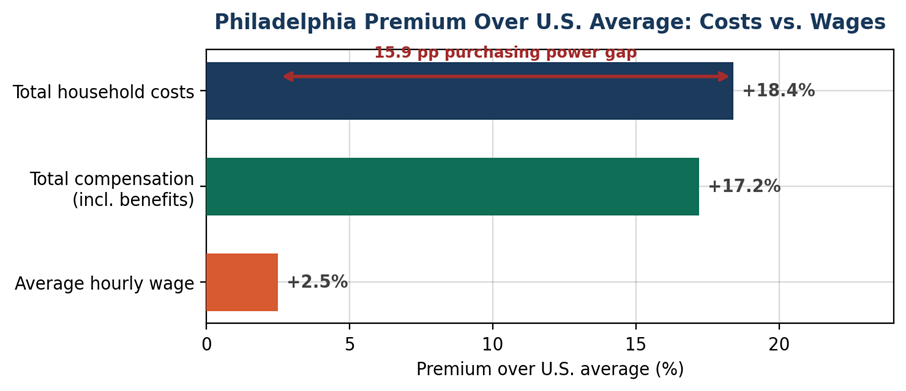
These higher costs are only partially offset by higher wages. The average hourly wage across all occupations in the Philadelphia area was $33.47 as of May 2024, just 2.5 percent above the national average of $32.66. Yet the total cost of living runs 18.4 percent higher. Middle Atlantic total compensation is more favorable at $54.09 per hour versus $46.15 nationally (a 17.2 percent premium), with insurance and retirement benefits contributing significantly. But for workers without robust benefit packages, the gap between modestly higher wages and substantially higher costs represents a real and widening purchasing-power squeeze.
Figure 6: Philadelphia Premium Over U.S. Average — Costs vs. Wages
Source: BLS Consumer Expenditure Survey (costs), OEWS May 2024 (wages), ECI Dec 2025 (compensation).
Price Levels in Regional Context
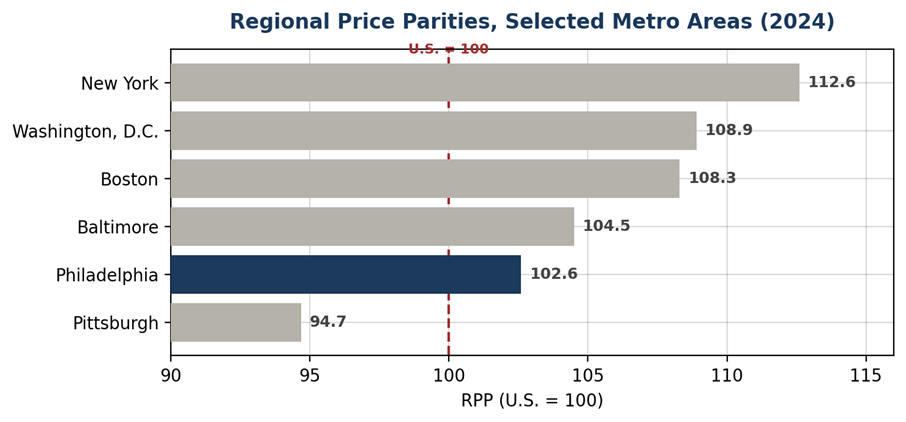
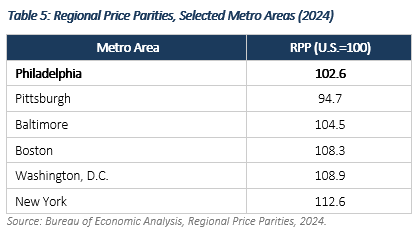
Philadelphia’s 2024 Regional Price Parity of 102.6 means goods and services in the metro area cost about 2.6 percent more than the national average. This places Philadelphia well below the most expensive Northeast metros but above Pittsburgh. When above-average inflation is layered onto an already above-average price level, the affordability margin narrows further.
Figure 7: Regional Price Parities, Selected Metro Areas (2024)
Source: Bureau of Economic Analysis, Regional Price Parities, 2024. Metro-area level.
Outlook and Policy Implications
The shift in Philadelphia's inflation trajectory from below-average to above-average is not transitory. It reflects the structural factors described above — aging housing stock, concentrated utility markets, a healthcare-heavy service economy — compounded by a labor market that, even as total nonfarm employment in the Philadelphia division dipped slightly (down 0.3 percent year-over-year as of February 2026), still supports wage growth in select sectors like education and health services (up 1.5 percent). The unemployment rate for the Philadelphia division rose from 4.6 percent in February 2025 to 5.3 percent in February 2026, above the national rate of 4.7 percent. These crosscurrents — rising prices, softening employment, and uneven wage gains — mean the affordability challenge is intensifying for households that can least absorb it.
Addressing that challenge requires action on both sides of the household ledger: reducing costs where possible and raising incomes where it matters most.
- Reducing costs. On housing, the region has seen meaningful new construction in recent years, particularly in Center City, University City, and riverfront corridors. But the new supply is overwhelmingly market-rate and luxury, and it has done little to relieve pressure at the price points where need is greatest. Within the city of Philadelphia, an estimated 52 percent of renters are cost-burdened — spending more than 30 percent of income on housing — with the burden concentrated among households earning below $50,000. The policy priority is therefore not simply more units but more units affordable to low- and moderate-income households, through inclusionary requirements, targeted public subsidy, preservation of existing affordable stock, and zoning reform that permits greater density in transit-served areas. On energy — the category with the widest regional-to-national gap — efficiency programs, rate-structure reform, and distributed generation offer pathways to structural relief, particularly for lower-income households who spend a disproportionate share of income on utilities.
Raising incomes. Pennsylvania's minimum wage remains at the federal floor of $7.25 per hour — the lowest among the four states in the Philadelphia-Camden-Wilmington metro area, where New Jersey has moved to $15.92 and both Delaware and Maryland stand at $15.00. For workers at the bottom of the wage distribution, this floor leaves a full-time annual income of roughly $15,000 against a regional cost of living that runs 18.4 percent above the national average. Whether through state legislative action, sector-specific wage standards, or expanded collective bargaining, closing the gap between entry-level earnings and regional living costs is essential to any credible affordability agenda.
There is a 15.9 percentage-point gap between the region's cost premium over the national average (18.4 percent) and its wage premium (2.5 percent). That gap will not close through cost reduction alone. The Philadelphia region's concentration of employment in healthcare, education, logistics, and professional services provides a strong foundation, but translating sectoral strength into broadly shared wage gains requires deliberate policy. Strengthened collective bargaining frameworks can help workers in growing but low-wage segments of the economy — food service, home health, warehousing — secure compensation that keeps pace with rising costs. Workforce development pipelines tied to quality employment standards, rather than volume placement alone, can connect residents to career-track positions in the region's anchor institutions. And employer-side strategies — retention incentives, benefit expansion, scheduling predictability — can reduce the turnover and instability that erode effective earnings even when nominal wages rise. The region's average weekly wage of $1,601 (versus $1,459 nationally) and its Middle Atlantic total compensation premium of 17.2 percent demonstrate that high-quality employment exists here; the challenge is broadening access to it.
The Philadelphia region's economy remains fundamentally strong, anchored by world-class universities, a deep healthcare and life-sciences sector, and a growing technology corridor. But the data are clear: price pressures are eroding the region's competitive advantage at the household level, particularly for those in the bottom half of the income distribution. Construction alone will not solve a problem that is equally about wages, bargaining power, and the distribution of economic gains. Addressing it requires coordinated action across housing, energy, and workforce policy — on both the cost side and the income side — precisely the kind of cross-sector agenda the Economy League is positioned to advance.
Data Sources and Methodology
This report draws on the following official data sources:
- CPI-U All Items, Philadelphia-Camden-Wilmington: BLS Series CUURS12BSA0. Bimonthly index values, 1982–84=100.
- CPI-U Category Indexes, Philadelphia: BLS Series CUURS12BSAH (Housing), CUURS12BSAT (Transportation), CUURS12BSAM (Medical Care), CUURS12BSEEB (Tuition/Childcare).
- CPI-U National Data: BLS national CPI detailed report, Table 1 (all expenditure categories, monthly). 12-month percentage change tables from bls.gov/cpi.
- BLS Economic Summary, Philadelphia: Updated May 4, 2026. Employment, wages, CPI, expenditure, and benefits data.
- Consumer Expenditure Survey: BLS, 2023–2024 biennial release, Philadelphia metro area.
- Regional Price Parities: Bureau of Economic Analysis (BEA), 2024 vintage, metro-area level.
- Occupational Employment and Wage Statistics: BLS, May 2024 release, Philadelphia area vs. national.
- Employment Cost Index: BLS, December 2025, Middle Atlantic census division vs. national.
- Housing and Renter Burden Data: Housing Initiative at Penn, “Current Housing Needs in Philadelphia” (May 2025); Econsult Solutions ACS-based analysis.
- Tax Rates: Pennsylvania Dept. of Revenue (3.07% PIT); City of Philadelphia Dept. of Revenue (3.74% wage tax, 8% sales tax, 1.3998% property tax).
- Childcare Costs: U.S. Department of Labor, National Database of Childcare Prices, county-level, 2008–2022.
Methodology note: All CPI data are not seasonally adjusted. Year-over-year changes compare 12-month percent changes. Cumulative figures are calculated from annual average index values. Philadelphia CPI data are published bimonthly. Consumer expenditure and wage data are for the broader Philadelphia-Camden-Wilmington MSA, not the city proper. Regional Price Parities are also at the metro level.

