Stop-And-Frisk in Philadelphia's Changing Neighborhoods
This Leading Indicator is derived from a capstone paper written by Christion Smith, an intern at the Economy League and a candidate for a Master’s Degree in Geographic Information Systems at Temple University.
Philadelphia has not been immune to gentrification, which is defined as an influx of residents with a higher socioeconomic status (SES) into a neighborhood dominated by a lower-SES population. Anecdotally, residents in gentrifying neighborhoods note that social norms and surveillance—particularly in the form of policing—change as previously low-income neighborhoods undergo the gentrification process. For this analysis, we test this anecdotal hypothesis over the years 2014 through 2019 using a typology of neighborhood types in relation to gentrification: (1) gentrifying neighborhoods, those that have seen substantial increases in incomes, home values, rent, and college-education residents; (2) non-gentrifying neighborhoods, traditionally low-income neighborhoods with higher concentrations of Black and Latinx residents that have not undergone the gentrification process; and (3) non-gentrifiable neighborhoods, those middle-income to wealthier neighborhoods that already have high levels of income, home values, rent, and college-educated residents in excess of the city’s median. Our primary goal in this analysis is to look at the interrelationship between neighborhood change and policing practices in Philadelphia.
Key Takeaways
- With an average violent crime rate of 17.2 per 100 residents between 2014 and 2019, violent crime is highest in the city’s non-gentrifying, predominantly low-income neighborhoods with higher concentrations of Black and Latinx residents.
- Gentrifying tracts experienced the second highest average violent crime rate between 2014 and 2019 at 13.4 per 100 residents, while non-gentrifiable tracts—mostly middle- to upper-income and predominantly white—had the lowest average violent crime rate over the six-year period at 6.7 per 100 residents.
- In 2019, there were an average of 57 stop-and-frisks for every 100 residents in non-gentrifying tracts.
- Gentrifying tracts saw an average of 33 police stops per 100 residents, while non-gentrifiable tracts saw 11.4 stops per 100 residents.
- Between 2015 and 2019, the average police stop rate was 3 times greater than the crime rate in non-gentrifying tracts.
- Between 2014 and 2019, there were on average 1.8 police stops for every violent crime reported in non-gentrifiable tracts - the lowest proportion among the three neighborhood types.
- In 2019, there were an average of 3.2 police stops for every violent crime reported in non-gentrifying tracts, 1.3 and 1.8 times the rate in gentrifying and non-gentrifiable tracts, respectively.
Gentrification as Neighborhood Change
Gentrification, or the influx of middle- or upper-class individuals into a predominantly low-income neighborhood, has received a vast amount of attention in academia, public policy circles, among social movements, and within the media and general public. As a form of neighborhood change, gentrification often leads to the alteration of the social and physical landscape of a neighborhood to cater to the tastes and norms of the incoming middle- to upper-class residents [1]. These changes often overlook or ignore the needs of the incumbent low-income residents - who are often communities of color that inhabited the neighborhood for decades building communities despite disinvestment and lack of attention from government [2]. In the typical gentrification pattern, real estate speculation and private development increase, which can lead to displacement of incumbent low-income residents, who generally relocate to more marginal neighborhoods [2]. In many cities, gentrification has been tied to a series of negative outcomes for low-income communities and inner-city communities of color.
Gentrification may also alter crime and policing patterns within cities. As neighborhoods become wealthier and whiter, the norms of safety and order tend to change – with newer businesses and residents utilizing the police more and demanding greater surveillance and security [3]. Greater police presence is often accompanied by negative associations and prejudices of race, ethnicity, and poverty that often targets low-income residents of color. Activities that were once normal in the pre-gentrification neighborhood become suspicious or cause for police intervention in the gentrified neighborhood [4]. In addition to increased police reports, general surveillance and police stop-and-frisks may also increase with gentrification since municipal leaders, business leaders, and real estate developers want outsiders to view the gentrifying neighborhood as safe [3,5]. This may exacerbate neighborhood turnover, as incumbent low-income residents and residents may be further targeted and influenced to leave gentrifying neighborhoods.
Philadelphia has not been immune to gentrification and its consequences [6,7,8]. We utilized a measure of gentrification to determine its effect on stop-and-frisk patterns in the city. As a police tactic, stop-and-frisk is framed as proactive in its approach. It allows officers to question and search anyone they deem to be partaking in “suspicious activities” [9]. Much research suggests that this tactic does little to reduce crime levels and that it disproportionately targets and labels people of color [10]. In fact, in 2010, the ACLU filed a federal lawsuit against the City of Philadelphia alleging that Philadelphia police officers had a pattern and practice of stopping and frisking pedestrians without reasonable suspicion and of disproportionately stopping Black and Latino men [11]. We posit a relationship between gentrification and changing norms of policing and surveillance: our hypothesis is that a gentrifying neighborhood would see a greater proportion of stop-and-frisk rates than the other neighborhood types.
Measuring Gentrification
Using Ding and Hwang’s seminal measure of gentrification that incorporates median household income, education, median home value, and median gross rent estimates from the U.S. Census [12], figure 1 illustrates gentrifying, non-gentrifying, and non-gentrifiable census tracts in Philadelphia from 2000 to 2019 while figure 2 details the aggregate demographic and criminality changes of these tracts during the same time period.
FIGURE 1
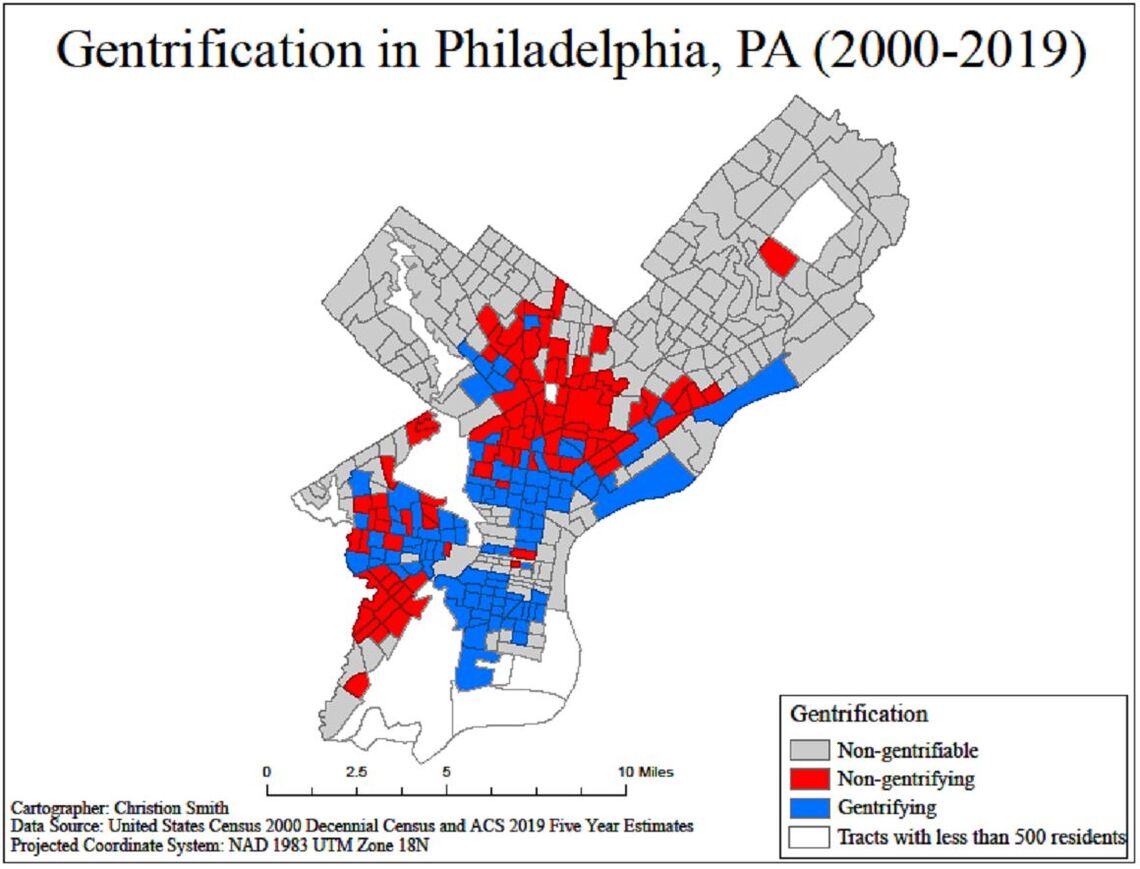
SOURCE: Data were obtained from the 2000 decennial census and the five-year estimates of the 2019 American Community Survey.
FIGURE 2
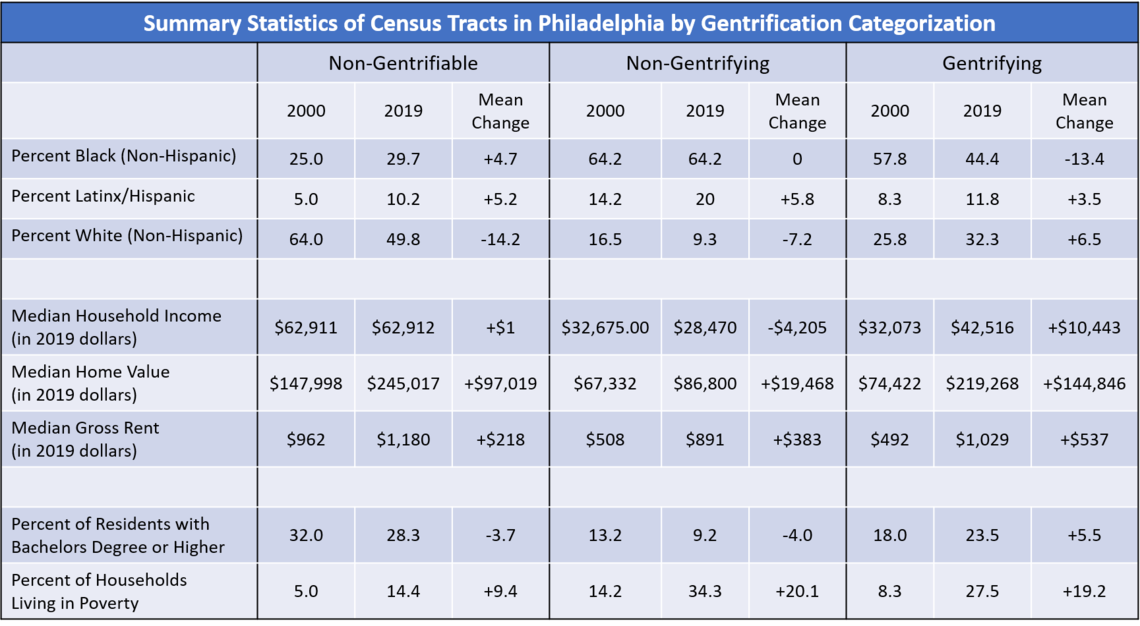
SOURCE: Data were obtained from the 2000 decennial census and the five-year estimates of the 2019 American Community Survey.
Both figures 1 and 2 demonstrate the disparities among non-gentrifiable, non-gentrifying, and gentrifying tracts. Non-gentrifiable census tracts, with a median household income in 2000 that exceeded the city’s median, are largely concentrated in Northwest and Northeast Philadelphia. Many Center City neighborhoods, like Old City, Washington Square, and Rittenhouse Square, along with Northern Liberties, Northern sections of Port Richmond, and Overbrook are all also largely non-gentrifiable. Figure 2 shows that these areas have seen slight increases in their Black and Latinx populations between 2000 and 2019, have seen very little change to their average median household income, modest increases in median home values and median gross rent, and almost a 10 percent increase in impoverished households. These changes may reflect the outward push of low-income residents to the outer neighborhoods of the Northeast and Northwest as competition for affordable homes increases in and around Center City and University City [13,14].
Non-gentrifying census tracts saw a median household income below the city’s median in 2000 but did not see enough of an increase in median home values, median gross rent, or a concentration of college-educated residents to be considered gentrifying. These tracts are largely concentrated in upper North Philadelphia and Southwest Philadelphia, along with scatterings in West Philadelphia, Center City, and one lone tract in Northeast Philadelphia by the airport. These are predominantly low-income neighborhoods and host a higher proportion of the city’s residents of color; in fact, these tracts saw relatively little change in the concentration of Non-Hispanic Black residents but saw 5.8 percent increase in Latinx residents since 2000. Yet, while still representative of concentrated poverty, home values and median gross rent in these tracts have seen slight upticks since 2000 – even when accounting for inflation.
Gentrifying tracts saw a median household income below that of the city’s median in 2000, but saw an increase in median home values, median gross rent, and the concentration of college-educated residents that exceeded that of the city’s median in 2000. These tracts surround greater Center City and include much of South Philadelphia, lower North Philadelphia, much of West Philadelphia (particularly neighborhoods closer to University City), along with sections of Port Richmond, Frankford, Ogontz, and Germantown. Many of the neighborhoods colloquially connected to gentrification—like Spruce Hill, Point Breeze, Callowhill, and Breweryrown—fall into this category [6]. Figure 2 shows that these tracts have seen significant increases in their Latinx and white resident concentrations, substantial increases in income, home values, and rent, and a general increase in college-educated residents. These areas have also seen rather large increases in impoverished households – a 19.2 percent increase between 2000 and 2019.
Gentrification and Crime
Using crime incident reports from the Philadelphia Police Department and demographic estimates from the American Community Survey, Figure 3 shows the average normalized violent crime rate of each neighborhood type from 2014 to 2019. This can be interpreted as the average number of violent crimes per 100 residents living in these neighborhood types.
FIGURE 3
SOURCE: Data were obtained from 2014 through 2019 Philadelphia Police Department crime incident reports and five-year estimates of the 2019 American Community Survey.
Figure 3 shows that violent crime is highest in non-gentrifying tracts, which are predominantly Black and impoverished. These tracts had an average violent crime rate of 17.2 between 2014 and 2019. Gentrifying tracts saw the second highest average violent crime rate at 13.4, while non-gentrifiable tracts had the lowest average rate violent crime over the six-year period at 6.7. There was a relative decrease in the average number of violent crimes per neighborhood from 2015 to 2018, but an increase for each neighborhood type in 2019.
Gentrification and Stop and Frisk
Figure 4 uses the Philadelphia Police Department’s vehicle and pedestrian investigation reports from 2014 to 2019 to show the average rate of stop-and-frisk stops per 100 residents in each neighborhood type. Similar to figure 3, non-gentrifying tracts had the largest proportion of stops, followed respectively by gentrifying and non-gentrifiable tracts. In fact, in 2019, non-gentrifying tracts—which are predominantly low-income with higher concentrations of Black and Latinx residents—saw an average of 57 stop-and-frisks for every 100 residents. The scale of stops greatly exceeds the violent crime rate.
FIGURE 4
SOURCE: Data were obtained from 2014 through 2019 Philadelphia Police Department vehicle and pedestrian investigation reports and five-year estimates of the 2019 American Community Survey.
To further highlight the disparities between crime and police stops, figure 5 calculates the proportion of police stops to violent crimes, or the average number of police stops for each violent crime reported. If the policy were applied equitably, the proportion would be constant across neighborhoods, that is, each neighborhood would experience police stops commensurate with its crime rate. As Figure 5 shows, police stops are not equitably distributed across neighborhoods in Philadelphia.
FIGURE 5
SOURCE: Data were obtained from 2014 through 2019 Philadelphia Police Department crime incident reports, vehicle and pedestrian investigation reports, and five-year estimates of the 2019 American Community Survey.
In 2014, gentrifying tracts saw 2.6 stops for every violent crime reported, higher than the other two categories. But from 2015 to 2019, non-gentrifying tracts consistently saw the highest proportion of stops for every crime reported, in fact an average stop rate 3 times greater than the crime rate. In 2019, non-gentrifying tracts saw the highest proportion of stops for every violent crime reported at 3.2 - 1.3 and 1.8 times the rate of gentrifying tracts and non-gentrifiable tracts, respectively. Non-gentrifiable tracts—those that are predominantly middle-income and white—saw the lowest proportion of stops for every violent crime reported, averaging around 1.8 stops for every violent crime reported between 2014 and 2019. The average stop-to-crime rate in gentrifying tracts was of 2.5 during the six-year period.
Conclusion
Gentrification has changed many neighborhoods throughout Philadelphia, particularly in so-called Greater Center City, and may have indirectly caused a positive feedback loop in urban policing practices in the city. The findings from this descriptive analysis beg questions about racial profiling of minority communities. Violent crime and police stops were heavily concentrated in non-gentrifying communities for the entire period, while non-gentrifiable and gentrifying tracts had lower violent crime and in turn received less police stops throughout the period. But what is striking is that that the proportion of police stops for each violent crime in non-gentrifying communities significantly outpaced stops in gentrifying and non-gentrifiable communities. Thus, we are led to reject our initial hypothesis that neighborhoods undergoing gentrification would experience higher rates of police stops. This could be attributed to the gentrification process itself, since it takes years for neighborhoods to change socially and economically. Neighborhoods undergoing this process usually experience higher levels of crime and police activity. From our analysis it appears that many neighborhoods may have been in advanced stages of the gentrification process in 2014, which is indicated by the gradual decrease in the proportion of police stops for each violent crime reported. Moreover, this could have led to a shift of police resources back to non-gentrifying tracts that tend to have a steady high crime rate, which resulted in non-gentrifying tracts having a higher police stop rate throughout the period.
Furthermore, while this analysis was limited by the categorical measure of gentrification rather than a continuous one it still managed to reveal trends in violent crime and police stops within communities undergoing that process. Future research is needed to measure the pace or degree of gentrification to capture differences that may be present when looking at crime and police stops. The expansion of this measure would help ascertain and extract key insights of what policing looks like in different stages of the neighborhood revitalization process. Our analysis uncovered trends of violent crime and police stops plaguing non-gentrifying communities that are predominantly Black, low-income, and bereft of social and economic resources. This type of analysis should inform an assessment of the efficacy and equity of stop and frisk policies.
Works Cited
[1] Saunders, Peter. 2016. “How To Understand Gentrification.” Forbes, 29 August. Retrieved from: (https://www.forbes.com/sites/petesaunders1/2016/08/29/understanding-gentrification/?sh=3c6390aa35ec).
[2] Mock, Brentin. 2019. “Where Gentrification Is an Emergency, and Where It’s Not.” CityLab, 5 April. Retrieved from: (https://www.bloomberg.com/news/articles/2019-04-05/where-it-hits-gentrification-hits-hard-study).
[3] Fayyad, Abdallah. 2017. “The Criminalization of Gentrifying Neighborhoods.” The Atlantic, 20 December. Retrieved from: (https://www.theatlantic.com/politics/archive/2017/12/the-criminalization-of-gentrifying-neighborhoods/548837/).
[4] Vo, Lam Thuy. 2018. “They Played Dominoes Outside Their Apartment For Decades. Then The White People Moved In And Police Started Showing Up.” Buzzfeed News, 29 June. Retrieved from: (https://www.buzzfeednews.com/article/lamvo/gentrification-complaints-311-new-york).
[5] Laniyonu, Ayobami. 2017. “Coffee Shops and Street Stops: Policing Gentrifying Neighborhoods.” Urban Affairs Forum, 9 November. Retrieved from: (https://urbanaffairsreview.com/2017/11/09/coffee-shops-and-street-stops-policing-practices-in-gentrifying-neighborhoods/).
[6] Bowen-Gaddy. 2018. “3 Maps that Explain Gentrification in Philadelphia.” PlanPhilly, 14 March. Retrieved from: (https://whyy.org/articles/3-maps-explain-gentrification-philadelphia/).
[7] Pew Charitable Trusts. 2016. Philadelphia’s Changing Neighborhoods: Gentrification and other shifts since 2000. Philadelphia, PA: The Pew Charitable Trusts. Retrieved from: (https://www.pewtrusts.org/~/media/assets/2016/05/philadelphias_changing_neighborhoods.pdf).
[8] Murrell, David. 2019. “Report: Philly Is Gentrifying More Than San Francisco, the Poster Child for Displacement.” City Life, 25 March. Retrieved from: (https://www.phillymag.com/news/2019/03/25/philadelphia-gentrification-report/).
[9] Thompson, Taahira. 2013. “NYPD’s Infamous Stop-And-Frisk Policy Found Unconstitutional.” The Leadership Conference Education Fund, 21 August. Retrieved from: (https://civilrights.org/edfund/resource/nypds-infamous-stop-and-frisk-policy-found-unconstitutional/).
[10] Keating, Dan and Harry Stevens. 2020. “Bloomberg said ‘stop and frisk’ decreased crime. Data suggests it wasn’t a major factor in cutting felonies.” The Washington Post, 27 February. Retrieved from: (https://www.washingtonpost.com/nation/2020/02/27/bloomberg-said-stop-frisk-decreased-crime-data-suggests-it-wasnt-major-factor-cutting-felonies/).
[11] ACLU Pennsylvania. 2018. “After Seven Years, Report Shows Philadelphia Police Continue to Illegally Stop and Frisk Pedestrians.” ACLU Pennsylvania, 20 November. Retrieved from: (https://www.aclupa.org/en/press-releases/after-seven-years-report-shows-philadelphia-police-continue-illegally-stop-and-frisk).
[12] Hwang, Jackelyn and Lei Ding. 2020. “Unequal Displacement: Gentrification, Racial Stratification, and Residential Destinations in Philadelphia.” American Journal of Sociology, 126(2): 354-406. Retrieved from: (https://www-journals-uchicago-edu.ezproxy.neu.edu/doi/full/10.1086/711015).
[13] Lubrano, Alfred. 2019. “Why is poverty increasing in Northeast Philly? Aging population, immigration, gentrification.” The Philadelphia Inquirer, 19 September. Retrieved from: (https://www.inquirer.com/news/poverty-northeast-philadelphia-aging-gentrification-immigration-20190919.html).
[14] Blumgart, Jake. 2018. “Want to move to a better neighborhood? In Philly, help is on the way.” PlanPhilly, 28 April. Retrieved from: (https://whyy.org/articles/want-to-move-to-a-better-neighborhood-in-philly-help-is-on-the-way/).