The Cost That Keeps Growing: Philadelphia's Employee Healthcare Problem and What It Means for the Budget

Philadelphia’s employee health insurance costs have grown from $484 million in FY2022 to a projected $718 million in FY2027 — a 48 percent increase in five years with no visible end in sight. No single labor negotiation caused this. No policy decision drove it. Healthcare costs grow, year after year, and Philadelphia has not developed a public strategy to address it. By FY2030, the line is projected to reach $783 million, representing a 62 percent cumulative increase over eight years.[1] That trajectory, unaddressed, will continue to narrow the city’s ability to fund every other priority it has named.
What you need to know
- Healthcare is the fastest-growing major cost in the budget. The city’s employee health and medical insurance line has risen from $484 million in FY2022 to a projected $718 million in FY2027 and $783 million by FY2030 — a 62 percent cumulative increase over eight years, with no containment mechanism visible in any of the four successive Five-Year Financial Plans reviewed.[1]
- Pension costs are falling over the same period. Pension obligations declined from $1.031 billion in FY2022 to $838 million in FY2027, reflecting decades of disciplined contribution strategy. Healthcare has no equivalent improvement arc.[1]
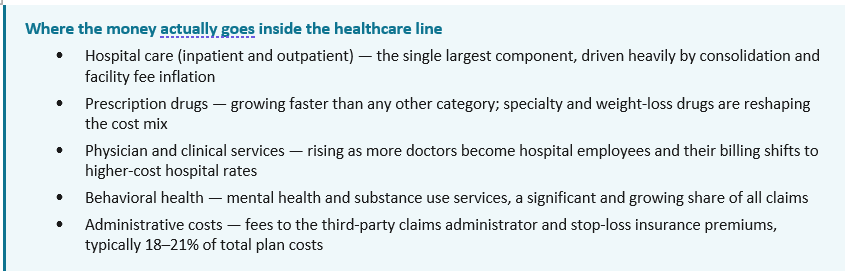
- These costs are not abstract — they pay for real, specific things. The healthcare line covers doctor visits, hospital stays, surgery, prescription drugs, emergency care, and behavioral health for roughly 26,000 active city employees and their dependents. A single employee hospitalization can cost $50,000 or more; newer weight-loss drugs like Ozempic run approximately $16,000 per patient per year. The city, as a self-insured employer, pays every one of those bills directly.[14]
- The increase is displacing real investment capacity. The $234 million rise in healthcare costs from FY2022 to FY2027 is nearly three times the city’s entire Homeless Services budget ($85 million) and exceeds the combined spending on the Department of Human Services, Public Health, and the Office of Homeless Services.[1]
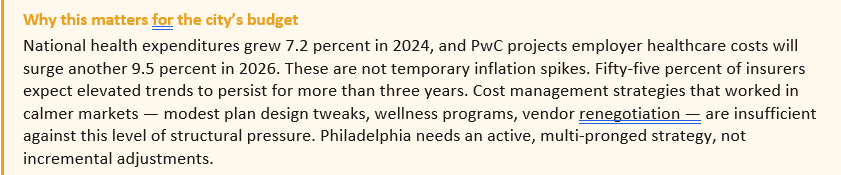
- Philadelphia’s growth rate is above national public sector norms. The city’s 7–8 percent annual healthcare cost growth is more than double the national state and local government benefit cost average of 3.5–4.7 percent reported by the Bureau of Labor Statistics.[2]
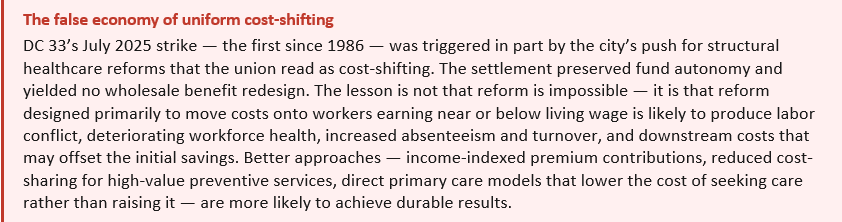
- Some cost-sharing solutions carry significant equity risks for Philadelphia’s workforce. Baltimore’s widely cited model shifted 20.8 percent of costs to employees — a tactic that generated savings but has been documented to reduce necessary care use among low-income workers. DC 33’s approximately 9,000 blue-collar workers earn an average of $46,000 per year, already $2,000 below Philadelphia’s living wage. Applying uniform cost increases to a workforce at that income level risks worsening health outcomes, not improving the budget. [6,15]. Other models need to be explored, such as the strategies employed by the labor union SEIU32BJ.
- The market itself is driving costs higher in ways no single employer can fully control. Private employers pay 254 percent of Medicare rates for hospital services, per RAND Corporation research. A single class of weight-loss drugs could increase employer premiums by 5–14 percent. Pharmacy benefit managers controlling 80 percent of the prescription drug market are under active FTC litigation for artificially inflating drug prices. These are structural forces, not cyclical ones.[10,11,12]
- Retiree healthcare adds another $1.6 billion in unfunded liability. Philadelphia carries a $1.6 billion OPEB (Other Post-Employment Benefits) liability for retiree healthcare, funded entirely pay-as-you-go. Today’s active employee cost trajectory directly shapes future retiree obligations.[4]
1. The Numbers, Plainly Stated
The healthcare cost line in Philadelphia’s General Fund has not had a down year in at least a decade. From FY2022 to FY2030, the city’s health and medical insurance appropriation grows as follows: $484 million (FY2022), $517 million (FY2025 actual), $653 million (FY2026 budget), $718 million (FY2027 proposed), and $783 million (FY2030 projected).[1] That is a 48 percent increase in five years and a 62 percent cumulative increase over eight years, at an average annual growth rate of roughly 7–8 percent.
The Bureau of Labor Statistics reports that benefit costs for state and local government employees grew at 3.5 percent over the twelve months ending December 2025.[2] The Kaiser Family Foundation’s 2024 employer health benefits survey found family premiums rose 7 percent across all employer types — meaning Philadelphia is tracking general market trends, not public sector best practice.[3] The distinction matters: an employer actively managing healthcare costs can reduce growth to 2–4 percent; one passively absorbing market increases pays the full 7–8 percent.
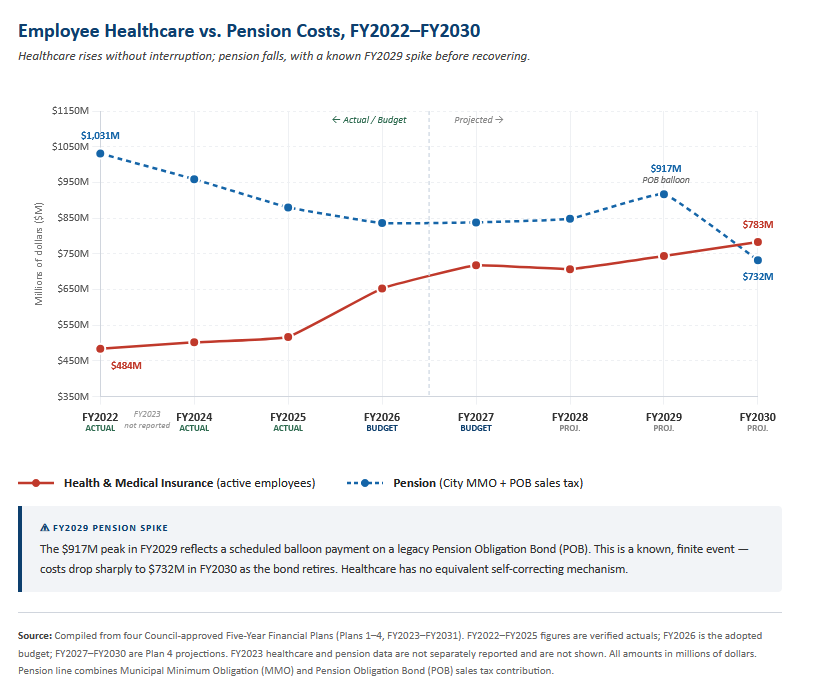
The contrast with pension costs is instructive. Pension obligations have actually fallen — from $1.031 billion in FY2022 to $838 million in FY2027 — reflecting the cumulative effect of a disciplined, multi-decade contribution strategy. A scheduled balloon payment on a legacy Pension Obligation Bond pushes costs to $917 million in FY2029 before dropping sharply to $732 million in FY2030 as the bond retires. That interruption is finite, visible, and already accounted for in the plan. Healthcare has no equivalent mechanism. There is no scheduled improvement, no actuarial trajectory toward resolution, and no containment plan described anywhere in the four Five-Year Financial Plans reviewed.[1]
What “employee health and medical insurance” actually means
For a layperson reading the budget, the $718 million line is easy to pass over as an abstraction. It is not. When a city sanitation worker goes to the emergency room, when a police officer fills a prescription, when a librarian’s child has surgery — Philadelphia pays that bill directly. The city is what is called a “self-insured” employer: it does not purchase traditional insurance from a carrier. Instead, it assumes the financial risk itself and pays medical claims out of its own funds, using a contracted administrator to process paperwork and a stop-loss policy to cover catastrophic individual cases.
That $718 million pays for doctor visits, hospital stays, emergency care, surgeries, prescription drugs, behavioral health services, and specialist care for roughly 26,000 active employees and their dependents. In practice, a single complex hospitalization can cost $40,000–$80,000. A cancer treatment course may run $150,000 or more. Newer weight-loss drugs like Ozempic and Wegovy list at approximately $1,300 per month — about $16,000 per patient annually[14] — and specialty drugs for conditions like rheumatoid arthritis or multiple sclerosis can exceed $100,000 per year. The city also carries $1.6 billion in future obligations for retiree healthcare benefits already promised to workers who have left service, funded entirely on a pay-as-you-go basis from current revenues.
2. Why This Is Different From Other Budget Pressures
Philadelphia’s budget faces several significant cost pressures — wages, debt service, capital commitments — but healthcare is structurally distinct in three ways that make it harder to address and more consequential to ignore.
- It is not negotiated in the same way wages are. Union contracts establish wage rates through direct bargaining. Healthcare premiums are set by market conditions, plan utilization, and plan design — factors that depend heavily on the healthcare market itself, not just on what two parties agree to at a bargaining table. A contract that settles wages at 3 percent does not automatically hold healthcare cost growth to 3 percent.
- It has no scheduled endpoint. Debt service grows when the city borrows and shrinks when bonds retire. Pension costs respond to funding ratios and actuarial assumptions, and Philadelphia’s pension is genuinely improving toward full funding by FY2033. Healthcare costs have no analogous self-correcting mechanism unless the employer actively intervenes.
- This is not a new problem. In 2008, the Pew Charitable Trusts and the Economy League published “Philadelphia’s Quiet Crisis,” documenting that healthcare costs had risen 80 percent in five years and projected they would consume 28 percent of the city budget by FY2012.[5] The current trajectory is a continuation of that problem — one that has persisted across multiple administrations, dozens of labor contracts, and four successive Five-Year Plans without a documented management strategy.
The market is making things worse
It would be easier if Philadelphia’s healthcare cost problem were primarily a local management failure. It is not. The national healthcare market is producing prices and cost trends that no single employer — not the city, not any large corporation — can fully offset. Three forces are particularly significant.
- Hospital consolidation has created sustained pricing power. RAND Corporation’s 2024 Hospital Price Transparency Study, covering $77 billion in spending across 4,000 hospitals, found that private insurers and employers pay an average of 254 percent of Medicare rates for hospital services.[10] When hospitals merge, prices in that market rise 20–60 percent and stay there. Ninety percent of hospital markets are now highly concentrated by federal antitrust standards. This is not a short-term anomaly — it is the pricing baseline employers are negotiating against.
- A new class of drugs has created a permanently higher cost floor. GLP-1 drugs — Ozempic, Wegovy, and similar medications used for weight loss and diabetes — cost approximately $16,000 per patient per year after manufacturer discounts.[11] Nationally, the share of eligible patients taking these drugs rose from 6.9 percent to 10.5 percent in two years. The Employee Benefit Research Institute estimates that expanding GLP-1 coverage could push employer premiums up by 5–14 percent, and 30 percent of large employers are already considering whether they can afford to keep covering these drugs.[11] Specialty drugs more broadly — already accounting for 62 percent of pharmacy spending while representing fewer than 2 percent of prescriptions — are launching at average prices exceeding $300,000 per treatment course.
Pharmacy benefit managers (PBMs) are under active federal scrutiny for inflating costs. In September 2024, the Federal Trade Commission sued the three largest pharmacy benefit managers — CVS Caremark, Express Scripts, and OptumRx — alleging that they used a rebate-driven system to inflate insulin list prices, block lower-price alternatives, and shift higher costs onto vulnerable patients. Together, these firms administer about 80 percent of all prescriptions in the United States, according to the FTC. The complaint cites Humalog as one example: its average list price rose from $21 in 1999 to more than $274 in 2017, an increase of over 1,200 percent.[12] State legislatures in all 50 states have now passed at least some form of PBM regulation, and Congress has held repeated hearings. Meaningful reform has been slow, but the scale of documented overcharging is substantial.
3. What It Is Actually Displacing
Budget tradeoffs are rarely announced. No appropriations document states that Homeless Services received less funding because healthcare cost more. But the displacement is real, and the arithmetic makes it concrete.
The $234 million increase in healthcare costs from FY2022 to FY2027 is nearly three times the city’s entire Homeless Services budget ($85 million), larger than the Planning and Development budget ($30 million), and exceeds the combined spending on the Department of Human Services, Public Health, and the Office of Homeless Services ($478 million).[1] The School District’s annual General Fund contribution has remained flat at $284 million for four consecutive years — flat in nominal terms, declining in real terms.[1] Whether these constraints are directly related to healthcare cost growth cannot be stated with certainty, but the budget arithmetic makes the connection visible: the city’s room for new investment exists only at the margins of a spending plan largely pre-committed to costs that are fixed, contractual, or politically durable.
A Manhattan Institute analysis of 25 California municipalities found that benefit cost growth outpaced spending on police, fire, parks, and libraries between 2004 and 2012, and that local government staffing levels remained 8 percent below pre-recession levels as late as 2014 — not for lack of revenue, but because fixed personnel costs absorbed the available growth.[13] The pattern is not unique to California.
By FY2027, employee benefits alone total $1.82 billion — more than the combined spending on Police, Fire, and Prisons ($1.71 billion) — before a single service delivery decision is made.[1] Healthcare is the fastest-growing component of that total and the one most amenable to intervention.
4. What Other Cities and Large Employers Have Done
Philadelphia is not alone in facing this pressure. Other cities and large public employers have documented results from strategies that could apply here. This is not a prescription — every approach requires collective bargaining, and the specifics of Philadelphia’s union structure add complexity. But the evidence shows the current trajectory is not inevitable.
Direct Primary Care (DPC) models offer a well-documented avenue for primary care cost control. The Town of Mount Pleasant, South Carolina implemented on-site primary care clinics with a fixed monthly membership fee for its 1,400 covered employees and dependents. From 2010 to 2022, the town sustained average annual cost growth of 1.65 percent — compared to the 7 percent industry trend — while reporting 99 percent program participation.[9] The mechanism is straightforward: when primary care is accessible and essentially free at point of use, chronic conditions are managed earlier, emergency department use falls, and downstream specialty costs decline.
Centers of Excellence (COE) for high-cost procedures direct employees to specific high-performing facilities for joint replacement, spine surgery, cardiac procedures, and cancer treatment. RAND Corporation’s evaluation of Carrum Health’s COE platform documented average savings of $16,000 per procedure, with 30 percent of employees originally recommended for surgery redirected to appropriate conservative care instead.[9] Philadelphia’s self‑insured medical coverage for several major active‑employee groups—documented in its FY2024 Annual Comprehensive Financial Report—provides the administrative foundation for this approach.[4]
Narrow and tiered network designs direct employees toward cost-effective providers through benefit design rather than mandate. Systematic research has associated these designs with 16–40 percent reductions in healthcare costs.[8]
Baltimore’s model: documented results, but not a direct template for Philadelphia
Baltimore’s comprehensive benefit reform between 2011 and 2013 is the most frequently cited peer example of municipal healthcare cost control. The city restructured its health benefit program through a standard network plan with deductibles, increased employee cost-sharing — establishing a split of roughly 79 percent city, 20.8 percent employee — a dependent eligibility audit, and tiered prescription drug cost-sharing. The reforms generated documented savings of approximately $150 million compared to baseline cost projections.[6]
The savings were real. But the central mechanism was cost-shifting to employees, and that approach carries significant equity risks when applied to a workforce like Philadelphia’s. Research is consistent on this point: higher cost-sharing reduces necessary healthcare utilization, and the effect is sharpest for lower-income workers. The landmark RAND Health Insurance Experiment, the most rigorous study ever conducted on cost-sharing, found that for the poorest and sickest participants, even modest cost-sharing led to worse health outcomes on four of thirty conditions measured, including uncontrolled hypertension and cholesterol.[16] A 2017 Kaiser Family Foundation review of 65 peer-reviewed studies found that even $1–$5 cost-sharing reduces utilization of vaccines, preventive care, and chronic disease medications among lower-income populations.[15]
For Philadelphia, the equity concern is concrete. AFSCME DC 33 represents approximately 9,000 blue-collar workers — sanitation employees, water department staff, 911 dispatchers — earning an average of $46,000 per year, already more than $2,000 below the city’s own living wage standard.[17] Asking workers at that income level to absorb higher premiums or deductibles does not simply redistribute costs — it predictably reduces their use of primary and preventive care, worsens management of chronic conditions, and ultimately produces more expensive downstream care: emergency room visits, hospitalizations, and complications that cost far more than the routine care that was initially avoided.
Direct contracting: promising cost control, but not a plug-and-play template for Philadelphia
Another version of the narrow-network approach is direct contracting: instead of relying primarily on a traditional insurer to assemble and price the provider network, a self-insured employer or health fund negotiates directly with a health system for a defined set of services, prices, and care-management expectations. That is the model behind the December 2025 agreement between the 32BJ Health Fund and Northwell Direct, which the parties described as the largest direct healthcare contract of its kind in the country. Under the agreement, 170,000 participants in the 32BJ Health Fund gained access to the full Northwell Direct network, while the fund projected first-year savings of $46 million, or about 20 percent, alongside sharply lower member copays for inpatient, outpatient, and physician care.
What makes this model important is not just the scale of the savings claim, but the mechanism. The 32BJ arrangement appears to reduce costs primarily by negotiating lower unit prices directly with the provider system, steering members into that lower-cost network through much lower copays, and creating a more integrated administrative relationship between the purchaser and the provider. At the same time, it did not eliminate flexibility entirely: 32BJ kept Anthem as a wraparound network for services outside Northwell and retained separate centers-of-excellence arrangements for some high-cost surgeries. In other words, this was not a pure “one network only” model; it was a preferred direct contract layered on top of a broader fallback structure.
For Philadelphia, the relevance is clear. Unlike Baltimore’s savings strategy, which relied heavily on shifting more costs onto workers, the 32BJ model is notable because it aims to save money by attacking prices and administrative friction rather than simply raising employee contributions. For a self-insured city, that distinction matters. Philadelphia already bears the underlying claims risk, so a model that lowers what the city pays per hospital stay, outpatient visit, or specialist encounter is structurally more promising than one that saves money mainly by deterring utilization among lower-income workers. In that sense, direct contracting may represent one of the few reform paths that aligns cost containment with equity rather than setting them against each other.
That said, the model is not plug-and-play. One important difference is that 32BJ is a labor-management health fund operating in the private-sector benefits system, while a city plan like Philadelphia’s would generally be treated as a governmental plan and would therefore face a different legal and procurement framework. More practically, direct contracting only works when the purchaser has enough member density in one market to matter to a provider system, the administrative capacity to manage claims and data closely, and the leverage to insist on strong contract terms around prices, quality, data-sharing, and stop-loss coordination. The 32BJ case should therefore be read less as a template to copy wholesale than as evidence that a large self-insured purchaser can use its scale to negotiate directly for lower-cost care instead of accepting standard carrier pricing as fixed.
5. The Forward Look
If the current trajectory continues unchanged — 7–8 percent annual growth — Philadelphia’s employee healthcare costs will reach approximately $850–$900 million by FY2031, the final year of the current Five-Year Plan. At that level, healthcare would approach the size of the entire Police Department budget and would consume a larger share of every new revenue dollar than any other single cost category.
The more immediate concern is context. The fund balance available for operations falls from $1.18 billion at the close of FY2025 to a projected $46 million by FY2029, even without any new fiscal shocks.[1] In that environment, there is no reserve capacity to absorb healthcare costs that exceed projections. A 10 percent premium increase — the kind Boston absorbed in FY2026 — arriving in FY2028 or FY2029 would produce a budget gap with no obvious source of offset except service cuts or emergency borrowing.
Philadelphia’s pension system improved from 45 percent funded in 2015 to 67 percent funded in 2024 — not by accident, but through sustained, deliberate policy over more than a decade.[1] Healthcare cost management requires the same treatment. The current plan does not provide it. The Economy League will continue to track this line across successive Five-Year Plans.
References
[1] City of Philadelphia. FY2027–FY2031 Five Year Financial and Strategic Plan. Presented to City Council, March 12, 2026; Philadelphia Verified Budget Reference Data, FY2022–FY2031, compiled from four Council-approved Five-Year Financial Plans.
[2] U.S. Bureau of Labor Statistics. Employment Cost Index — December 2025. USDL-26-0184, February 10, 2026. https://www.bls.gov/news.release/eci.nr0.htm
[3] Kaiser Family Foundation. 2024 Employer Health Benefits Survey. October 9, 2024. https://www.kff.org/health-costs/2024-employer-health-benefits-survey/
[4] City of Philadelphia. Annual Comprehensive Financial Report, FY2024. Published February 24, 2025. https://www.phila.gov/media/20250519125628/annual-comp-financial-report…
[5] Pew Charitable Trusts and Economy League of Greater Philadelphia. “Philadelphia’s Quiet Crisis: The Rising Cost of Employee Benefits.” January 23, 2008. https://www.pew.org/en/about/news-room/press-releases-and-statements/20….
[6] Baltimore Bureau of the Budget and Management Research. FY2026 Executive Summary. https://bbmr.baltimorecity.gov/sites/default/files/upload/FY2026%20Exec…
[7] NYC Comptroller. “Health Care Costs: The Hidden Risks in the Financial Plan.” June 2, 2025. https://comptroller.nyc.gov/reports/health-care-costs-the-hidden-risks-…
[8] Gruber, J. & McKnight, R. “Narrow Networks on the Health Insurance Marketplaces.” Health Affairs, 2017. https://www.healthaffairs.org/doi/10.1377/hlthaff.2016.1669
[9] ICMA. “Better Care, Better Health, and a Brighter Future for Employees and Their Families.” PM Magazine. https://icma.org/articles/pm-magazine/better-care-better-health-and-bri…; RAND Corporation, Centers of Excellence savings data.
[10] RAND Corporation. Prices Paid to Hospitals by Private Health Plans: Findings from Round 5.1. December 2024. https://www.rand.org/health/projects/hospital-pricing/round5.html
[11] Employee Benefit Research Institute. GLP-1 Coverage and Its Impact on Employment-Based Health Plan Premiums: A Simulation-Based Analysis. October 2025. https://www.ebri.org/content/full/glp-1-coverage-and-its-impact-on-empl…; Blue Cross Blue Shield Association, “GLP-1 Drugs Could Raise Employer Health Premiums.” 2025.
[12] Federal Trade Commission. “FTC Sues Prescription Drug Middlemen for Artificially Inflating Insulin Drug Prices.” September 20, 2024. https://www.ftc.gov/news-events/news/press-releases/2024/09/ftc-sues-pr…
[13] Eide, Stephen D. “California Crowd-Out: How Rising Retirement Benefit Costs Threaten Municipal Services.” Manhattan Institute, April 2015. https://manhattan.institute/article/california-crowd-out
[14] Peterson-KFF Health System Tracker. “Perspectives from employers on the costs and issues associated with covering GLP-1 agonists for weight loss.” 2024. https://www.healthsystemtracker.org/brief/perspectives-from-employers-o…
[15] Kaiser Family Foundation. “The Effects of Premiums and Cost Sharing on Low-Income Populations: Updated Review of Research Findings.” June 2017. https://www.kff.org/medicaid/the-effects-of-premiums-and-cost-sharing-o…
[16] RAND Corporation. 40 Years of the RAND Health Insurance Experiment. 2016. https://www.rand.org/health/projects/HIE-40.html
[17] CBS Philadelphia. “Do DC 33 members make a living wage? Philadelphia workers’ union strike by the numbers.” July 2025. https://www.cbsnews.com/philadelphia/news/philadelphia-strike-salary-li…
Part of the Leading Indicators series on Philadelphia’s FY2027 budget.

