Immigrant Growth Is Now Regional—and Multicounty

Foreign-born residents accounted for 60% of Greater Philadelphia’s net population gain since 2000, while distinct communities formed different county centers
What you need to know
- Foreign-born population growth is now central to the region’s overall growth. Foreign-born residents accounted arithmetically for 350,600—or 60%—of the MSA’s 584,867 net population gain from 2000 to 2020-24. At the county level, foreign-born gains exceeded total growth in Philadelphia and Camden and nearly matched it in Delaware County because their native-born stocks declined or were essentially flat.1
- Philadelphia’s regional share fell early, then plateaued. The city contained 35.0% of the MSA’s foreign-born residents in 2000, 32.5% in 2005-09, and 32.3% in 2020-24. Since 2005-09, the share has stayed in a narrow 32.3% to 33.4% range.
- Greater Philadelphia remains a middle-tier immigrant destination. In the 2024 ACS one-year estimates, foreign-born residents were 12.4% of the metro population (the five-year figure used elsewhere in this brief is 11.8%)—below the United States (14.8%), Atlanta (16.0%), Boston (20.7%), Washington (24.7%), New York (30.8%), and Miami (43.6%), but close to Charlotte (12.9%) and Baltimore (12.2%).
- Recent growth was broad and measurable. From 2015-19 to 2020-24, the MSA added an estimated 75,761 foreign-born residents. Nine counties had gains greater than the combined 90% margin of error; Philadelphia added the most (+17,080), followed by Montgomery (+10,802) and New Castle (+9,911).
- Country of birth reveals several settlement systems. Montgomery is the largest center for India- and Korea-born residents; Philadelphia for China- and Dominican Republic-born residents; and New Castle for Mexico-born residents. Camden and Philadelphia have statistically indistinguishable Philippines-born totals.
Central distinction
These are resident stocks, not migration flows. A county can gain residents through direct international arrival, a move from elsewhere in the United States, or a move within the MSA; it can lose residents through departures or deaths. The tables do not follow individuals, so they cannot test a one-way “city-to-suburb migration” hypothesis.
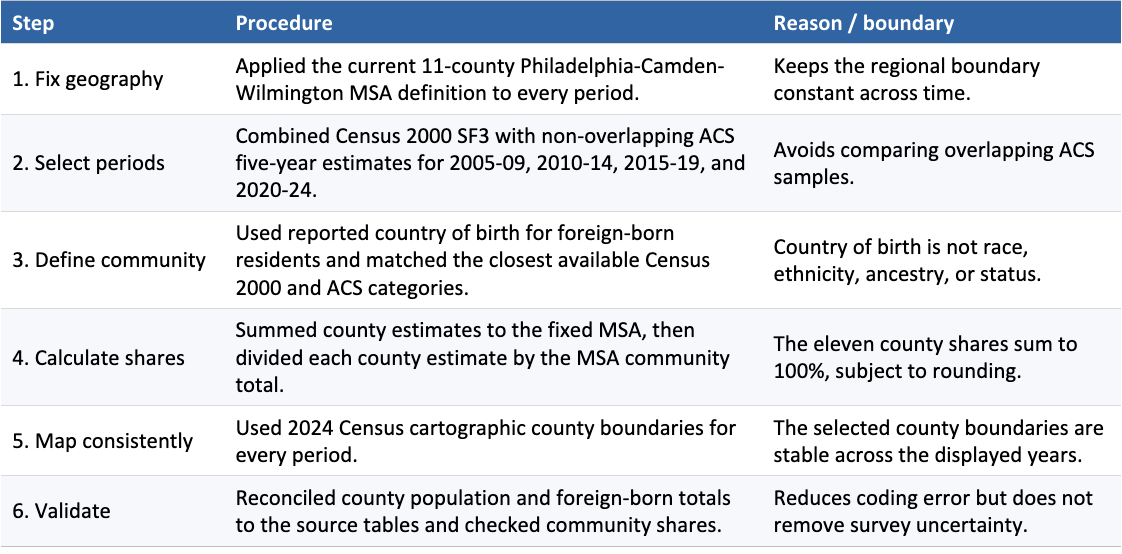
The analysis holds the current 11-county Philadelphia-Camden-Wilmington MSA constant across every period: Bucks, Chester, Delaware, Montgomery, and Philadelphia counties in Pennsylvania; Burlington, Camden, Gloucester, and Salem in New Jersey; New Castle in Delaware; and Cecil in Maryland.6
Throughout, “community” means foreign-born residents grouped by reported country of birth—not race, ethnicity, ancestry, citizenship, language, or legal status.9
The economic signal is the composition of population growth
Nationally, annual Census population estimates show that net international migration accounted for most metropolitan population growth between July 1, 2023, and July 1, 2024. The subsequent Vintage 2025 estimates show that metropolitan growth slowed between July 1, 2024, and July 1, 2025 as net international migration fell. These are recent national trends. Greater Philadelphia’s residence-stock comparison covers a much longer period: Census 2000 compared with the pooled 2020–24 ACS five-year estimates. Across those endpoints, the foreign-born population rose from 391,829 to 742,429—an increase of 89.5%—while the total population increased by 10.3%.
Between Census 2000 and the 2020–24 ACS period, foreign-born residents accounted for 350,600 of the MSA’s 584,867 observed net population gain. The native-born stock increased by 234,267, or 4.4%—roughly 0.2% per year. This accounting identity is not a “without immigration” counterfactual. It is narrower than a broader measure of immigrant-associated population growth because U.S.-born children of immigrants appear in the native-born component; the estimates also do not isolate births, deaths, or domestic migration.

Source: U.S. Census Bureau, Census 2000 Summary File 3 and 2020-24 ACS five-year estimates; ELGP calculations. Components describe changes in resident stocks, not causal contributions.
Why it matters: a region with slow growth in its native-born resident stock is increasingly reliant on immigrant population growth to expand its overall population base. That is relevant to long-run labor supply, consumer demand, schools, housing, and public finance—but this brief does not measure any of those outcomes directly.
Philadelphia’s foreign-born share remains below the national rate—but the gap has narrowed
The 2024 ACS one-year estimates put Greater Philadelphia’s foreign-born share at 12.4%, below the national share of 14.8%. Philadelphia sits near Baltimore and Charlotte, well below Atlanta and established gateway metros, and above Pittsburgh. The comparison describes scale, not performance: a higher foreign-born share is neither inherently better nor worse, and metro industrial mix, history, and gateway status differ.5
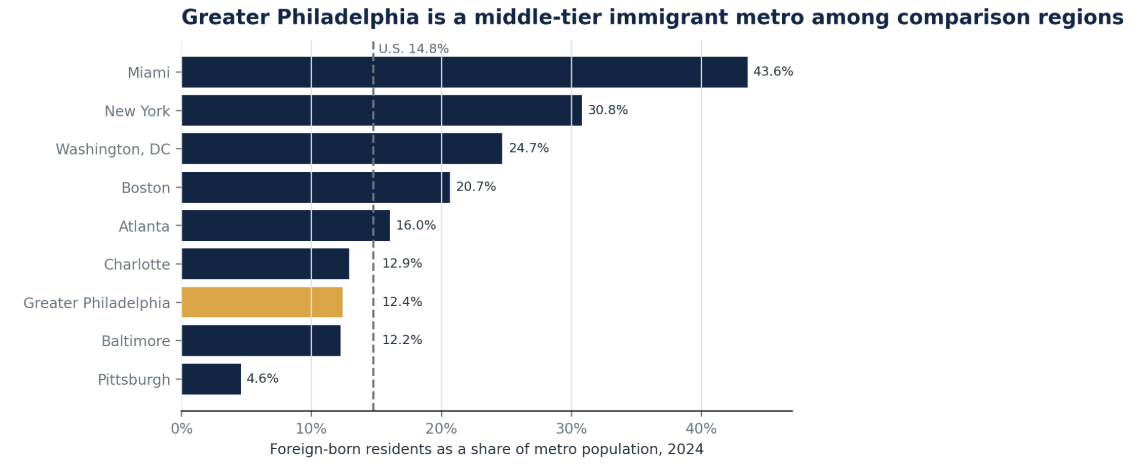
Source: U.S. Census Bureau, 2024 ACS one-year detailed table B05002; ELGP calculations. All metros use Census 2024 geographies. The peer chart is a one-year estimate and should not be substituted into the five-year county time series.
The national gap has narrowed. The fixed 11-county region’s foreign-born share rose from 6.9% in 2000 to 12.4% in the 2024 one-year ACS, while the U.S. share rose from 11.1% to 14.8%. The difference therefore fell from 4.2 to 2.4 percentage points. That is evidence of convergence in resident shares—not proof that Greater Philadelphia is currently attracting immigrants faster than peer metros.4, 5
The benchmark changes the regional interpretation. Greater Philadelphia’a foreign-born population has nearly doubled since 2000, attracting foreign-born residents faster than the US as a whole, but its current foreign-born share remains far below New York, Washington, Boston, or Miami. Its position is better described as a middle-tier or re-emerging gateway, narrowing its long-run gap with the nation.
Philadelphia’s share declined before it stabilized
Using the full historical baseline resolves the apparent contradiction in earlier drafts. Philadelphia’s share of the MSA’s foreign-born residents fell from 35.0% in 2000 to 32.5% in 2005-09. After that early decline, the share plateaued: 32.3% in 2010-14, 33.4% in 2015-19, and 32.3% in 2020-24.
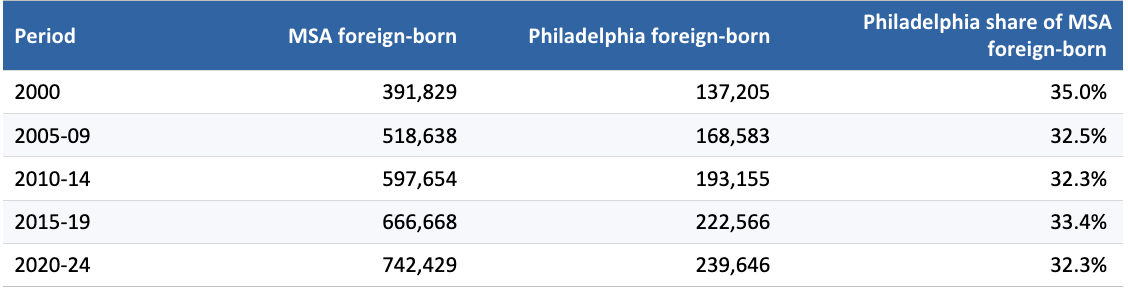
Table 1 source: Census 2000 SF3 and ACS five-year estimates; ELGP calculations. The 2000 baseline and later ACS windows differ in survey design.
Most foreign-born residents—67.7%—lived outside Philadelphia in 2020-24. Yet the city’s share has not continued falling since 2005-09. The durable pattern is roughly one-third in the city and two-thirds across the other counties, not a recent broad city exit.
Pew’s 2024 city-level ACS microdata analysis indicates two-way movement: roughly half of Philadelphia’s newest immigrants came from another U.S. location, while Montgomery was both the top prior county for movers into the city and the top destination for foreign-born Philadelphians who left.12
The current period shows broad gains, not a single suburban story
The change from 2015-19 to 2020-24 is the most relevant non-overlapping ACS comparison. The MSA’s foreign-born estimate increased by 75,761, or 11.4%. Philadelphia contributed the largest absolute increment, about 22.5% of the MSA increase. Montgomery, New Castle, Camden, and Burlington together contributed another 50.2%.
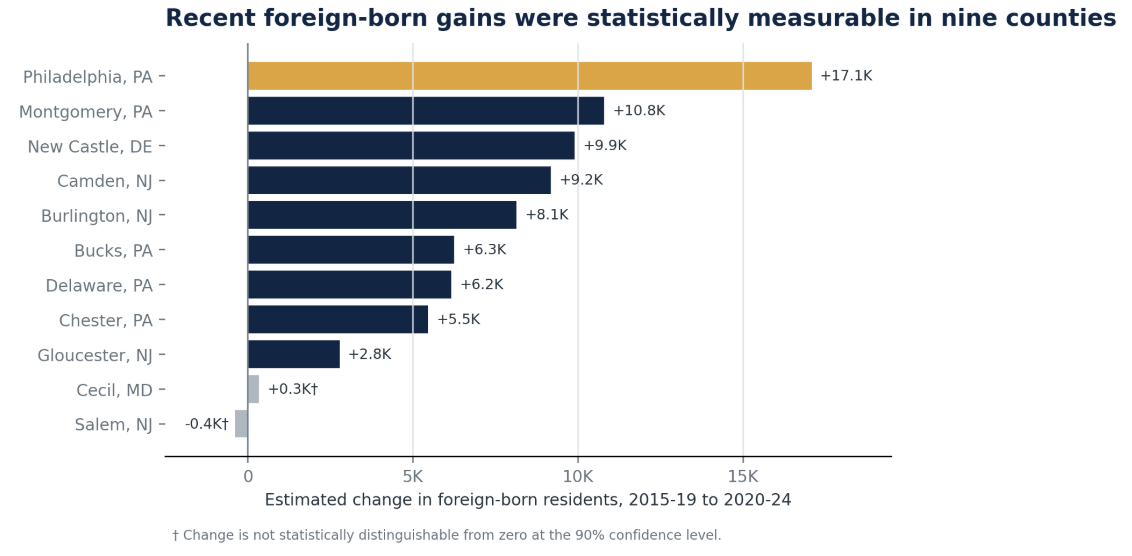
Source: U.S. Census Bureau, ACS five-year estimates; ELGP calculations. Statistical screen compares the absolute difference with the square root of the summed squared 90% margins of error. Five-year periods are non-overlapping.
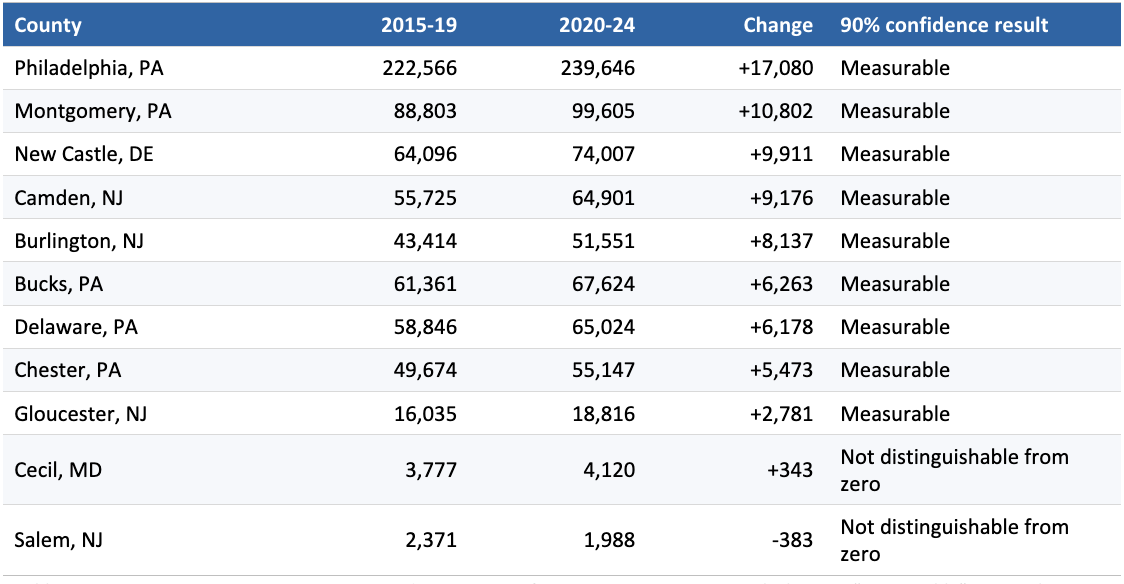
Table 2 source: U.S. Census Bureau, 2015-19 and 2020-24 ACS five-year estimates; ELGP calculations. “Measurable” means the point-estimate difference exceeds the combined 90% margin of error; it is a conservative screen, not a formal test using replicate weights.
This recent view corrects two tempting overstatements. Cecil’s +343 and Salem’s −383 are not distinguishable from zero at the 90% confidence level. And percentage changes alone can exaggerate small-base movements; absolute gains show that the city and several large suburban counties changed together.
Several settlement systems coexist inside one MSA
County totals conceal the most distinctive feature of Greater Philadelphia’s immigrant geography: communities organized by country of birth do not share one regional center. “Share of the MSA community” means the percentage of all MSA residents born in a selected country who live in a selected county. The denominator changes with the selected birthplace, not with the county.
A 2008 Brookings study described Philadelphia as a re-emerging gateway with strong suburban immigrant growth. The expanded 2000-to-2020-24 evidence sharpens that observation: the suburban geography is not a single ring around the city. It is a collection of community-specific county networks.11
All maps use the same 2024 Census county boundary files so that changing cartography does not create a false visual change.10
India-born settlement shifted from a city lead to a multicounty network
The India-born population increased from 32,551 in 2000 to 88,353 in 2020-24. Philadelphia held the largest county share in 2000, 23.4%. By 2020-24, Montgomery held 19.2%, Chester 16.9%, and Philadelphia 14.5%. The gap between the top two county estimates is larger than their combined 90% margin of error, but the broader finding is dispersion: no county contains even one-fifth of the regional community.
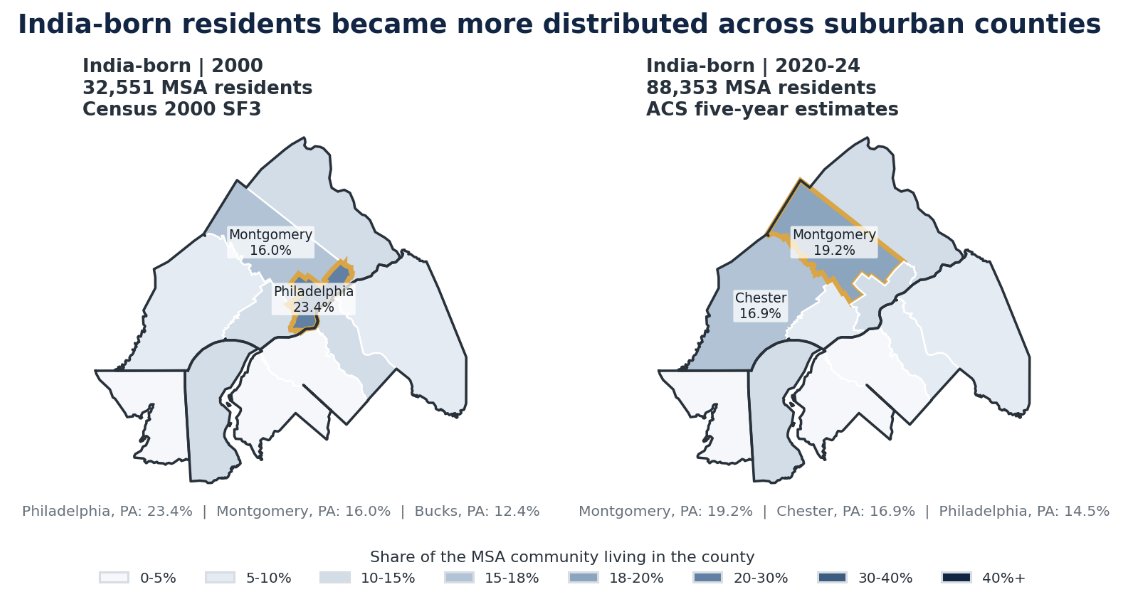
Source: ELGP analysis of Census 2000 SF3, 2020-24 ACS five-year estimates, and 2024 Census cartographic boundaries. Both panels use identical legend bins. The highlighted border marks the leading point estimate in each period.
Korea- and China-born residents retain different anchors
Montgomery is the region’s clear Korea-born center: 8,245 residents, or 36.2% of the MSA community, compared with Philadelphia’s 17.6%. China-born settlement is oriented differently. Philadelphia contains 27,747 residents, or 43.8% of the regional community, while Montgomery is second at 14.7%. One suburban-centered geography and one city-centered geography operate at the same time.
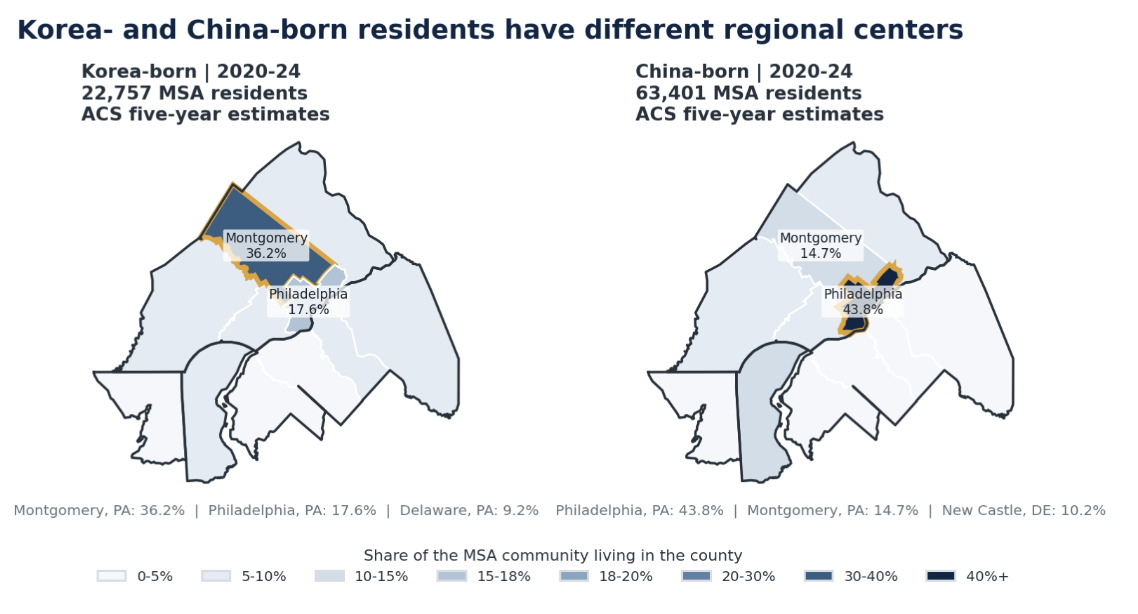
Source: ELGP analysis of 2020-24 ACS five-year estimates and 2024 Census cartographic boundaries. Both panels use identical legend bins. “China” follows the B05006 parent line and includes Hong Kong and Taiwan.
Mexico- and Dominican Republic-born settlement follows different corridors
New Castle and Chester together contain 41.6% of Mexico-born residents, creating a southern and western arc across the Delaware-Pennsylvania line. Philadelphia and Camden, by contrast, contain 79.6% of Dominican Republic-born residents. The two communities therefore encounter different county, state, school-district, and service systems even though both are part of the same MSA.
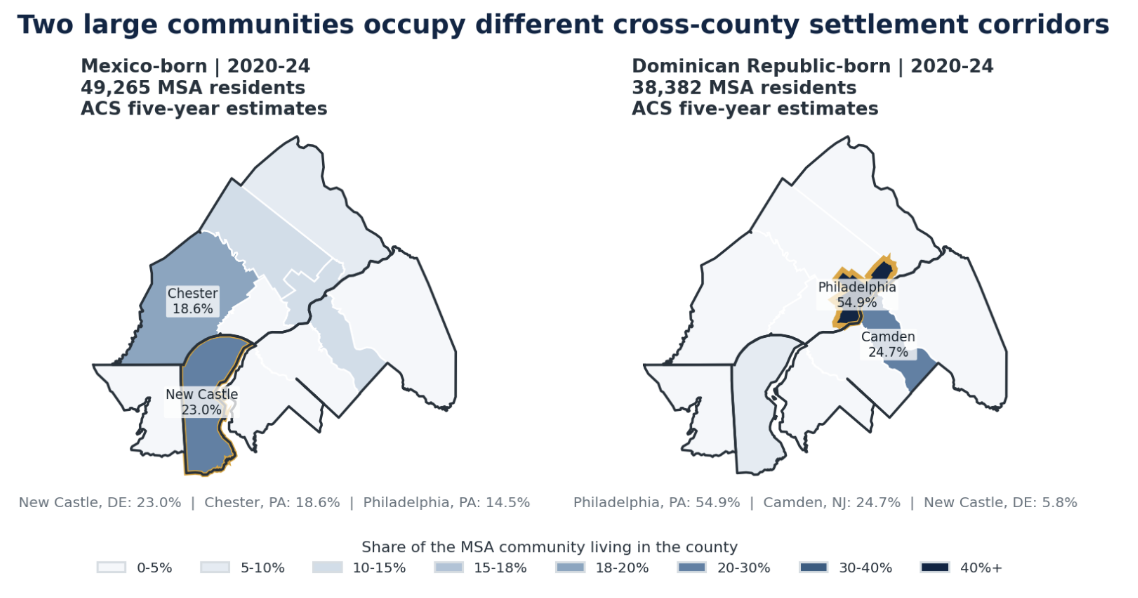
Source: ELGP analysis of 2020-24 ACS five-year estimates and 2024 Census cartographic boundaries. Both panels use identical legend bins.
Six communities summarize the range
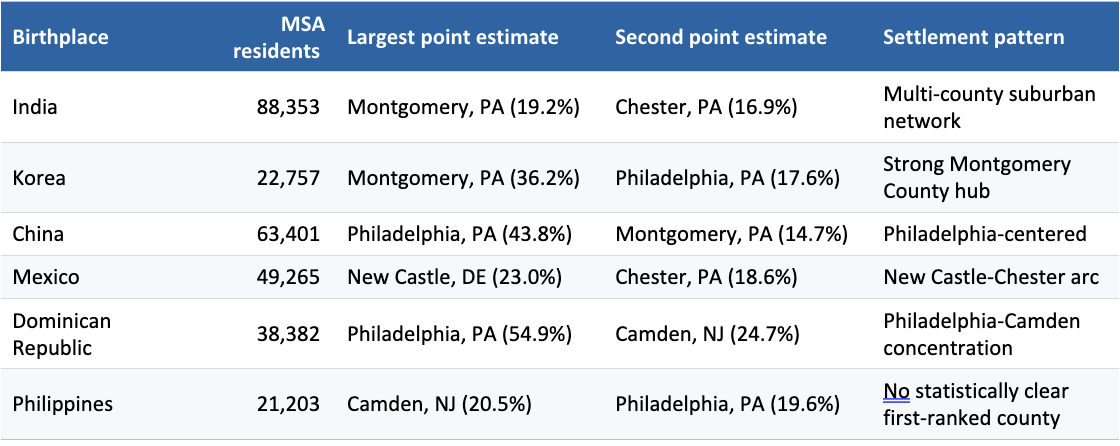
Table 3 source: U.S. Census Bureau, 2020-24 ACS five-year table B05006; ELGP calculations. Percentages show where each MSA birthplace community lives. “China” follows the B05006 parent line and includes Hong Kong and Taiwan. For Philippines-born residents, Camden’s estimate (4,341 ±572) and Philadelphia’s (4,156 ±989) are statistically indistinguishable at 90% confidence.
What the residence patterns mean for the region
County growth divides into two demographic regimes
The regional 60% figure masks an important county split. In Philadelphia and Camden, foreign-born gains were larger than total population gains because their native-born stocks declined. In Delaware County, the foreign-born gain nearly matched total growth because its native-born stock was essentially unchanged. The remaining counties show positive point estimates for both components. At the county level, foreign-born growth is therefore the entire net-growth accounting story in the first group and one part of broader population growth in the second.
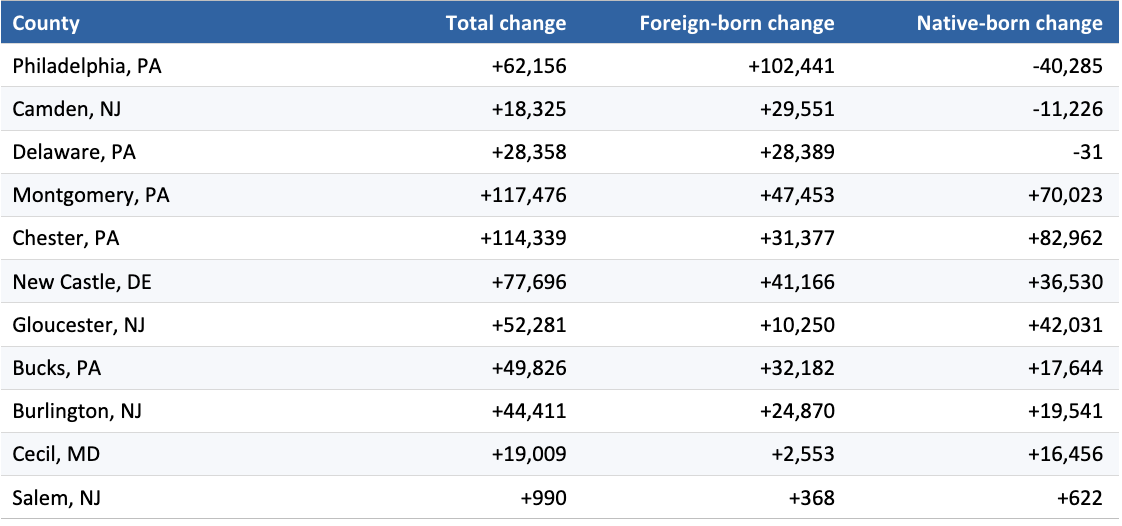
Table 4 source: U.S. Census Bureau, Census 2000 SF3 and 2020-24 ACS five-year estimates; ELGP calculations. Values are arithmetic changes in resident stocks. The 2000 and ACS survey designs differ, and no formal significance test is applied to these endpoint changes.
The economic implication is not that a map proves a labor-market relationship. It does not. The implication is that population growth, potential workers, consumers, students, and entrepreneurs are increasingly distributed across multiple jurisdictions. Regional institutions that treat immigrant communities as a Philadelphia-only constituency will miss most foreign-born residents and several of the largest origin-specific centers.
The settlement systems are also operationally different. Montgomery is pivotal for India- and Korea-born communities; Philadelphia for China- and Dominican Republic-born communities; and the New Castle-Chester corridor for Mexico-born residents. Workforce outreach, language access, small-business engagement, transit planning, and school coordination may therefore require different county partnerships by community. The residence evidence identifies where to investigate; it does not establish occupation, industry, earnings, or commuting patterns.
Finally, the peer gap and the slow long-run growth of the native-born resident stock make immigration policy and attraction capacity material regional risks. If foreign-born growth slows, the region has little long-run native-born stock growth to offset it. If it continues, the need for cross-state and cross-county coordination will grow. Because the latest ACS window ends in 2024, none of these estimates captures immigration-policy and enforcement changes beginning in 2025; their regional effects remain an open question. These are forward-looking implications, not forecasts.
What would change this assessment
- A sustained move in Philadelphia’s share outside the 32% to 33% band in the next non-overlapping ACS period would indicate a new phase rather than a plateau.
- Year-of-entry data showing that recent arrivals are disproportionately settling in particular counties would help separate current gateways from the accumulated resident stock.
- PUMS or linked administrative evidence on residence, workplace, industry, and commuting could establish whether the settlement systems are also labor-market systems.
- Replicate-weight testing could refine the conservative margin-of-error screen, especially for small counties and closely ranked origin groups.
Conclusion
Greater Philadelphia’s immigrant geography changed in two stages. Philadelphia’s share of the region’s foreign-born population declined between 2000 and 2005-09, then plateaued near one-third as both the city and surrounding counties added residents. Over the full period, foreign-born residents accounted for 60% of observed net population gain, making foreign-born growth a central part of the region’s demographic trend even though its foreign-born share remains below the national level and many major peers.
Within that regional growth story, there is no single settlement pattern. India-, Korea-, China-, Mexico-, Dominican Republic-, and Philippines-born residents form different county networks. That finding is the actionable one: Greater Philadelphia is increasingly multicounty, but not uniformly suburban—and regional strategy has to begin with the geography each community actually occupies.
Methodology, definitions, and audit trail
This section provides the steps needed to reproduce the estimates and clarifies exactly what the indicators mean.
Indicator definitions
Foreign-born = anyone who was not a U.S. citizen at birth, including naturalized U.S. citizens and noncitizens. The category does not identify immigration status.
Country-of-birth community = foreign-born residents grouped by reported country of birth. It is not a race, ethnicity, ancestry, citizenship, language, or legal-status category.
Where the MSA community lives (%) = residents born in country X who live in a selected county / all residents born in country X across the fixed 11-county MSA. For example, Montgomery’s 36.2% Korea-born value means that 36.2% of all Korea-born residents in the MSA live in Montgomery County. It does not mean 36.2% of Montgomery residents are Korea-born.
Estimated community residents = the estimated number of foreign-born residents from the selected country living in the county.
Community residents per 1,000 total residents = the county community estimate / the county’s entire population × 1,000.
Community share of county foreign-born (%) = the county community estimate / all foreign-born residents in that county.
Location quotient = the community’s share of a county’s foreign-born population / the community’s share of the MSA’s foreign-born population. A value above 1 indicates greater concentration than the MSA average.
Resident-stock change = later estimated residents - earlier estimated residents. It is not a count of people who migrated between the two places.
Uncertainty and comparability
- ACS values are estimates for pooled five-year periods. Margins of error in the dashboard are 90% confidence intervals for the published community estimates.7, 8
- Census 2000 and the ACS use different survey designs. Endpoint comparisons should be read as evidence of long-run direction and scale, not exact year-to-year change.
- Map shading displays point estimates. Small differences between counties—or changes involving small communities—may not be statistically meaningful.
- Some communities were not separately reported in Census 2000. Missing values are not treated as zero.
- Country labels follow ACS table B05006 and the closest Census 2000 PCT19 category. “China” uses the B05006 parent line, which includes Hong Kong and Taiwan; no 2000-to-2020-24 China comparison is reported. The categories may not capture internal diversity or changing national boundaries.
- The analysis cannot distinguish direct international arrivals, within-MSA moves, moves from elsewhere in the United States, departures, or demographic change.
- The latest residence period is 2020-24 and therefore ends on December 31, 2024. It predates immigration-policy and enforcement changes in 2025 and should not be read as evidence about later conditions.
Notes and sources
- 1. U.S. Census Bureau, Census 2000 SF3 and 2024 ACS five-year tables B05002 and B05006; ELGP calculations.
- 2. Wilder and Mackun, U.S. Census Bureau, Some Metro Areas’ Population Gains Reversed COVID-19 Era Trends, April 17, 2025.
- 3. U.S. Census Bureau, Vintage 2025 Population Estimates, March 26, 2026.
- 4. U.S. Census Bureau, The Foreign-Born Population: 2000; national foreign-born share of 11.1%.
- 5. U.S. Census Bureau, 2024 ACS one-year table B05002; ELGP calculations.
- 6. U.S. Office of Management and Budget, Bulletin 23-01, MSA delineations; BLS-hosted copy.
- 7. U.S. Census Bureau, Comparing 2024 American Community Survey Data.
- 8. U.S. Census Bureau, Statistical Testing Tool and 90% margin-of-error guidance.
- 9. U.S. Census Bureau, ACS foreign-born population tables B05002, B05005, and B05006.
- 10. U.S. Census Bureau, 2024 cartographic boundary files used to draw every county map.
- 11. Audrey Singer, Domenic Vitiello, Michael Katz, and David Park, Recent Immigration to Philadelphia: Regional Change in a Re-Emerging Gateway, Brookings Institution, 2008.
- 12. The Pew Charitable Trusts, Philadelphia’s Immigrants: Race and Ethnicity, June 13, 2024 (updated September 3, 2024); 2018-22 ACS Public Use Microdata Sample.
Data note
Local statistics are ELGP calculations from the cited Census tables. Counts and shares are estimates; maps use the underlying Census tables and 2024 boundary files.

