The People Behind Greater Philadelphia’s Growth

By Saloni Tandon, Director of Research & Analytics
Edited by Jeff Hornstein, Executive Director
November 10, 2026
Immigration and economic outcomes across Greater Philadelphia
Foreign-born residents accounted for approximately 60% of Greater Philadelphia’s net population increase between Census 2000 and the 2020–2024 survey period. Across the 11-county metropolitan area, growth in the foreign-born population made up 350,600 of the estimated 584,867 additional residents.1
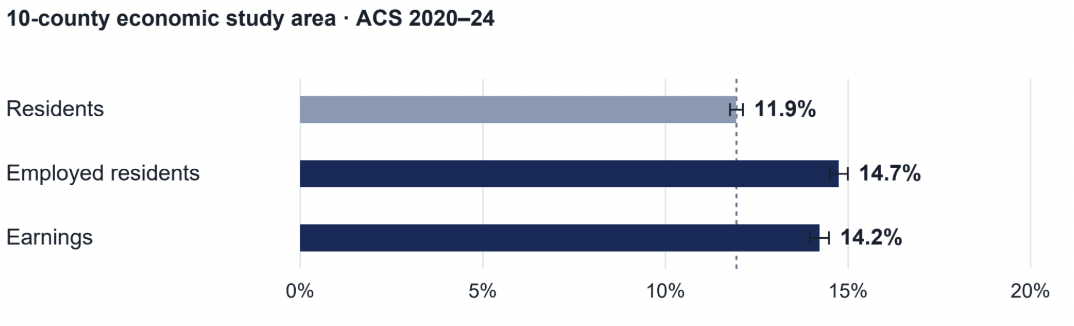
Foreign-born residents account for a larger share of employment and earnings than of the population. In the 10-county economic study area, the 2020–2024 estimates put their shares at approximately 12% of residents, 15% of employed residents, and 14% of employed residents’ earnings. These figures are relevant to planning for the region’s workforce, housing, transportation, and public services.2
The analysis shows a substantial role in regional growth and economic activity alongside differences in education, employment, and household resources. Those differences become clearer when the city and surrounding communities are examined separately. Understanding where people live and how they fare can help employers and public institutions plan services and assess workforce needs. An accompanying interactive analysis provides the underlying evidence and methods.
What you need to know
Foreign-born residents account for most of the metro’s observed population growth. Growth in the foreign-born population made up 60% of the 11-county metro’s net population increase from 2000 to 2020–2024. This describes population change, not what would have happened without immigration.1
Worker and earnings shares exceed population share. Foreign-born residents make up 11.9% of residents and 14.7% of employed residents, and receive 14.2% of employed residents’ earnings in the 10-county study area.2
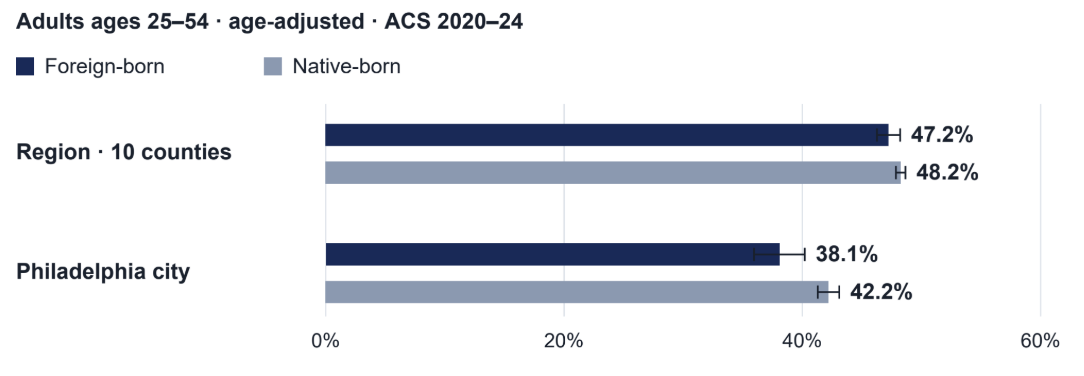
The city education gap is not a regional finding. Among adults ages 25–54, age-adjusted bachelor’s-or-higher attainment is 38.1% for foreign-born and 42.2% for native-born Philadelphia residents. The gap is statistically distinguishable at 90% confidence; the regional comparison of 47.2% and 48.2% is not.4
Some bachelor’s degree holders work in occupations with lower entry requirements. An estimated 13,200 ±1,600 employed foreign-born Philadelphia residents ages 25–54 with at least a bachelor’s degree work in such occupations. The margin reflects 90% sampling uncertainty.4
Household income differs by householder nativity. In the 10-county study area, median income is about $86,900 for households with a foreign-born householder and $92,000 for those with a native-born householder, in 2024 dollars.2
These sources do not measure long-term talent retention. The student totals and employer-application records used here do not track individuals from study into long-term local careers.6,7
Figure 1. Foreign-born residents account for 60% of net population growth
Estimated net increase in residents, 11-county metropolitan area, Census 2000 to ACS 2020–2024

A regional story with several local centers
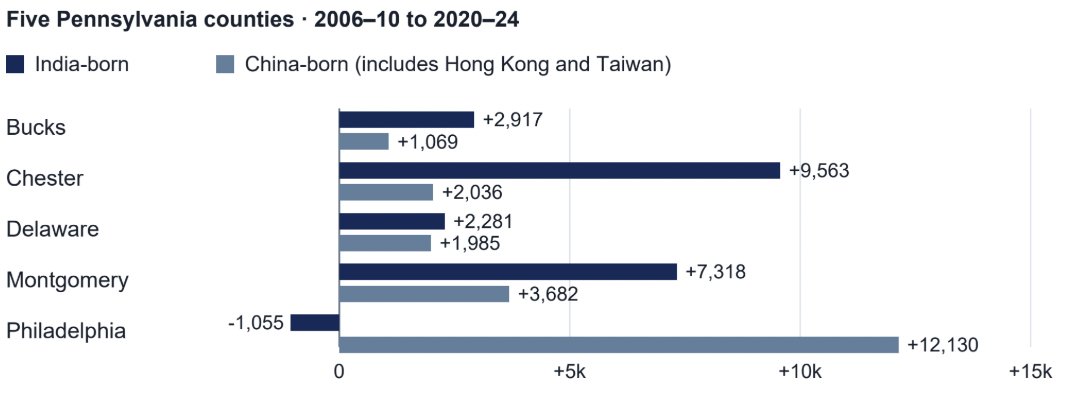
Across the five Pennsylvania counties examined, estimated growth in the India-born population was largest in Chester (+9,563) and Montgomery (+7,318) between 2006–2010 and 2020–2024; Philadelphia’s estimate was slightly lower. For the Census category combining residents born in China, Hong Kong, and Taiwan, Philadelphia had the largest estimated increase (+12,130) and the largest population in 2020–2024. The two communities illustrate how settlement patterns vary within the region.3
Figure 2. India-born and China-born growth have different local centers
Estimated change in residents by county, five Pennsylvania counties, 2006–2010 to 2020–2024
Settlement patterns help identify where institutions may need to strengthen community relationships. Libraries, schools, employers, and local governments can use these estimates to plan outreach, then consult residents about local needs. Birthplace alone does not establish language or service needs.
Reading the maps
Growth outside Philadelphia does not establish that residents moved there from the city. The estimates show where people lived during each survey period; they do not track individual moves.
Economic contributions extend beyond a population count
Within the 10-county study area, foreign-born residents’ share of employed residents is approximately 1.23 times their population share. Their share of earnings is approximately 1.19 times their population share. These ratios describe representation in economic activity; they are not financial returns on investment or measures of individual productivity.2
Figure 3. Worker and earnings shares exceed the foreign-born population share
Foreign-born share of residents, employed residents, and earnings, 10-county study area, ACS 2020–2024
These measures describe employed residents, including people whose jobs are outside the study area. Industry and occupation comparisons add detail about the work they do. Self-employment provides another measure of economic participation, although it does not count every business owned or job created.
A substantial share of the workforce can coexist with difficulty entering employment or advancing within it. Age composition affects the relationship between population and worker shares, so comparisons among adults of similar ages are needed to assess employment outcomes.
Education patterns differ between the city and region
Among adults ages 25–54, after accounting for differences in age composition, the share with a bachelor’s degree or higher is 47.2% for foreign-born residents and 48.2% for native-born residents across the 10-county region. That difference is not statistically distinguishable from zero at the 90% confidence level.4
In Philadelphia city, the age-adjusted shares are 38.1% for foreign-born and 42.2% for native-born adults ages 25–54. The foreign-born share is 4.1 percentage points lower, a statistically distinguishable gap at 90% confidence. The city finding should not be generalized to the 10-county region.
Figure 4. The city education gap is not the regional result
Share of adults ages 25–54 with a bachelor’s degree or higher, age-adjusted, ACS 2020–2024
Educational attainment alone does not show how qualifications relate to employment. An estimated 13,200 ±1,600 foreign-born employed Philadelphia residents ages 25–54 with a bachelor’s degree or higher work in occupations that the U.S. Bureau of Labor Statistics classifies as typically requiring less than a bachelor’s degree for entry. The uncertainty shown is a 90% sampling margin of error. The count includes only occupation categories whose component jobs all have typical entry requirements below a bachelor’s degree.4
This estimate identifies a population whose career experiences warrant closer examination. It does not establish where their degrees were earned, whether credentials were recognized, or how fully they use their skills. Occupations requiring less than a bachelor’s degree can still involve considerable skill and good pay.
Earnings add another dimension. Among full-time, year-round workers ages 25–54 without a bachelor’s degree, foreign-born residents have lower median annual earnings in both the city and the wider study region. Comparisons among college graduates vary by geography and work schedule.5 These findings support examining job access and career progression separately from educational attainment. Interviews with workers and employers could help assess factors such as hiring practices and credential recognition, which these Census comparisons do not measure.
Household income adds context to workforce measures
Regional earnings describe economic activity. Household finances show the resources available to people living within that economy. In the 10-county study region, median household income is approximately $86,900 for households with a foreign-born householder, compared with $92,000 for those with a native-born householder, in 2024 dollars. The difference is statistically distinguishable at the 90% confidence level.2
Household size and composition differ, so income alone does not establish equivalent living standards. Reading income alongside poverty, homeownership, and housing costs gives a fuller picture of economic well-being.
For workforce planning, this means considering whether employment provides stable resources relative to household costs, as well as whether residents have jobs.
Student and employer records do not measure retention
Greater Philadelphia’s international connections also run through its universities and employers. The Institute of International Education’s Open Doors data report 50,848 international students and Optional Practical Training participants in Pennsylvania in 2024/25. Optional Practical Training, or OPT, is temporary employment related to an eligible international student’s field of study. This is a statewide figure, not a metropolitan total.6
Separately, U.S. Department of Labor disclosure data identify 6,739 certified, single-worksite H-1B Labor Condition Applications for worksites in the 11-county metro in fiscal year 2024. These are employer applications, not counts of unique workers, visas issued, or completed hires.7
The two sources describe different stages of a possible education-to-employment pathway. Neither follows individuals through graduation, local employment, and a long-term career, so student totals and application counts cannot be combined into a retention rate.
Measuring retention would require evidence linking study, local employment, and later career outcomes. Universities and employers could help investigate those transitions. The figures presented here describe educational enrollment, practical training, and employer applications; they do not establish how many participants remain in the region.
Putting the evidence to work
The central finding is that foreign-born residents account for substantial shares of Greater Philadelphia’s population growth, employment, and earnings, while their circumstances vary across communities. Regional totals are a starting point for local decisions.
Service providers can use settlement estimates to identify where to consult residents. Employers and workforce organizations can examine education alongside job placement and earnings before choosing a response. Household measures add context about living costs, while universities and employers need additional evidence to assess talent retention. Local decisions should take account of both the regional pattern and the circumstances of the communities they serve.
Explore the evidence
Planning local services? Start with community locations, then look at household and workforce conditions.
Recruiting or developing workers? Connect occupation patterns with education, employment, and earnings.
Assessing economic well-being? Read household income alongside poverty, homeownership, and housing costs.
Working on international talent? Explore students and sponsorship, keeping recruitment activity separate from evidence of retention.
About the evidence
The population analysis covers the 11-county metropolitan area. Custom economic analysis covers 10 counties, excluding Salem County, New Jersey. Community maps cover Bucks, Chester, Delaware, Montgomery, and Philadelphia counties and 22 selected birthplace groups. These boundaries should not be treated as interchangeable.
Most detailed economic estimates use 2020–2024 American Community Survey five-year public-use microdata. These estimates predate the immigration-policy and enforcement changes that began in 2025. Student and employer-application data have their own periods, stated above. The occupation measure applies BLS education assignments from the 2025–35 projections to the 2020–2024 survey records; the classification date does not make it a measure of 2025 or 2026 employment.
Foreign-born means people who were not U.S. citizens at birth, including naturalized citizens and noncitizens; birthplace does not identify current immigration status. Native-born includes people born in the United States or its territories and people born abroad to U.S.-citizen parents.
Age-adjusted education rates give both groups the same distribution across ages 25–34, 35–44, and 45–54, using the combined 10-county population as the standard. Sampling margins and within-place difference tests use all 80 ACS replicate weights and 90% confidence intervals. Failure to detect a difference does not establish equality, and these descriptive comparisons do not, by themselves, establish causes.
Notes and sources
1. Population growth. Economy League analysis of Census 2000 Summary File 3 and ACS 2020–2024 estimates. The 60% figure is 350,600 divided by 584,867. Both endpoints are estimates, and the comparison describes changes in resident populations rather than migration flows or a causal counterfactual. Published population analysis
2. Economic participation and household income. Economy League calculations from ACS 2020–2024 public-use microdata. Worker and earnings measures cover civilian employed residents ages 16 and older. Household groups are classified by the householder’s nativity; income is in 2024 dollars. Share ratios use matching geography and unrounded estimates. Metric file · Economic methods · Census PUMS documentation
3. Community settlement. ACS table B05006, aggregated across the five Pennsylvania counties, comparing 2006–2010 with 2020–2024. Changes are descriptive and have not been subjected to aggregate significance tests; tract boundaries differ between periods. Community methods · Community estimates
4. Education and occupation alignment. Regional education gap: −1.0 ±1.0 percentage points (unrounded −1.017 ±1.030); city gap: −4.1 ±2.5 points. Occupation count: 13,219 ±1,641, reported as approximately 13,200 ±1,600. All margins are at 90% confidence. The count includes civilian employed residents ages 25–54 with a bachelor’s degree or higher only when every matched component occupation has a BLS typical entry requirement below a bachelor’s degree; unresolved categories are excluded, and sampling margins do not capture classification uncertainty. Metric identifiers: skills.ba_plus.adjusted.region, skills.ba_plus.adjusted.city, occupation.count.city. Metric file · Skills methods and occupation mapping · BLS classification definitions
5. Earnings by education. ACS 2020–2024 microdata; civilian employed residents ages 25–54 with positive annual earnings. Full-time, year-round means at least 35 usual hours a week and 50 weeks a year. Medians use interpolation within $1,000 bins and all 80 replicate weights. The comparisons do not measure pay for identical jobs. Earnings methods
6. International students. Institute of International Education, Open Doors 2025, Pennsylvania state fact sheet and Fast Facts. The 2024/25 Pennsylvania total of 50,848 includes OPT participants. Pennsylvania fact sheet · Open Doors Fast Facts
7. Employer applications. U.S. Department of Labor, Office of Foreign Labor Certification disclosure data; certified single-worksite H-1B Labor Condition Applications in fiscal year 2024, filtered by worksite in the 11-county metro. Multi-worksite applications are excluded. Metric identifier: applications.2024.region. Talent methods · Department of Labor disclosure data
