Philadelphia’s Career Ladder Isn’t Disappearing — But Its First Rung May Be Changing

By Saloni Tandon, Director of Research & Analytics
Edited by Jeff Hornstein, Executive Director
August 25, 2026
What the evidence does, and does not, show about generative AI and the entry point to professional work in Greater Philadelphia
Summary
National evidence is beginning to show a split at the bottom of the career ladder. Since late 2022, workers ages 22–25 have lost ground in some of the occupations most exposed to generative AI, and several studies point to slower hiring rather than layoffs as the main channel. But the timing is not clean: white-collar hiring had already begun to cool before ChatGPT, and remote work and the broader post-pandemic slowdown also appear to be weighing on young workers.
Greater Philadelphia has good reason to pay attention. Generative-AI exposure is concentrated in white-collar and clerical work, while office and administrative support has been losing share of regional employment. At the same time, surveyed employers in the Federal Reserve’s 3rd District report changes in the type of worker they need more often than reductions in overall headcount.
This means the most important distinction in this Leading Indicator is hiring rather than employment. Employment tells us how many workers firms already have; hiring tells us how readily new workers can get in. A firm can keep headcount steady while recruiting fewer entry-level workers, leaving junior vacancies unfilled, or asking experienced employees to absorb work that once went to less-experienced staff. If Philadelphia’s first rung is narrowing, the change is likely to appear in hiring data before it becomes visible in total employment or unemployment.
Reading this leading indicator
Every figure is labeled by geography and period because the Philadelphia MSA, the Philadelphia-Camden metropolitan division, the City of Philadelphia, and the Third Federal Reserve District are not interchangeable. Superscript numbers refer to the numbered sources on the final pages. Where a figure could not be confirmed against a primary source, the brief says so rather than presenting it as established.
Key findings
- Exposure is high and concentrated. Twenty-five percent of jobs in the Philadelphia-Camden-Wilmington MSA are in occupations ranked in the top national quartile for generative-AI exposure (2024 employment data, published October 2025) - tied with State College and behind only Trenton-Princeton (34%) among Third District metros.1
- The national warning signal is at the hiring margin. In the United States, employment among workers ages 22–25 in AI-exposed occupations between November 2022 and June 2026 is estimated at about 19% below where it would be had it kept pace with less-exposed peers. The gap is attributed mainly to reduced hiring; experienced workers show no comparable shortfall.2
- AI is not a sufficient explanation. In the United States, the relative decline in AI-exposed job postings began before ChatGPT’s late-2022 release, and the New York Fed finds no clear junior-versus-senior split within highly exposed occupations.3 Separately, remote work is estimated to explain 64% of the recent rise in unemployment among young college graduates.4
- Clerical work is losing share of regional employment. Office and administrative support fell from 12.5% of Philadelphia MSA employment in May 2023 to 11.9% in May 2024, continuing a longer-running shift shaped by enterprise software, self-service systems, offshoring, and other forms of automation.6
- Philadelphia’s professional services job engine stalled after 2022. Professional and business services employment in the MSA grew just 0.7% between June 2022 and June 2026, an unusually weak four-year performance outside recession and pandemic periods. Education and health services supplied 101,700 of the region’s 149,200 net new jobs, or 68% of all growth.16
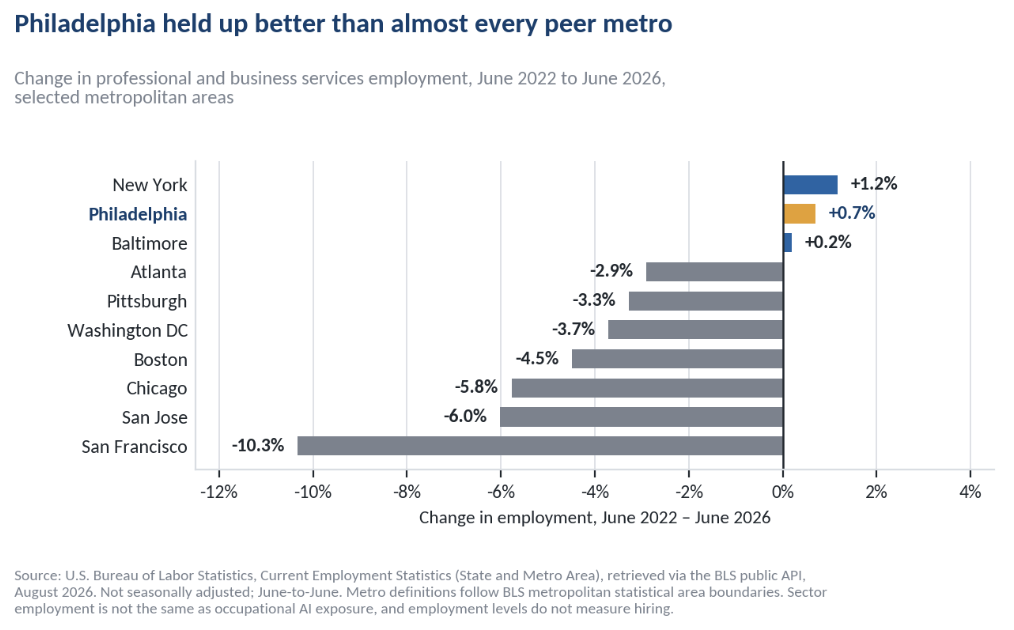
- But that stall is national, not local. Professional and business services employment fell in seven of nine peer metros between June 2022 and June 2026, from −2.9% in Atlanta to −10.3% in San Francisco. Philadelphia’s flat result ranked second of ten.16
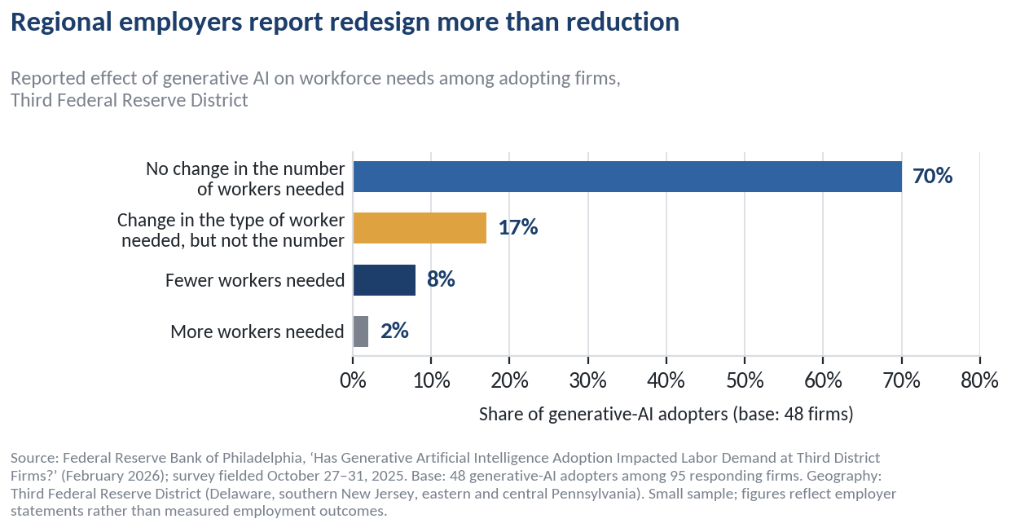
- Third District employers report redesign more often than reduction. Among generative-AI adopters in the Third Federal Reserve District surveyed in October 2025, 70% reported no change in the number of workers needed, while 17% reported a change in the type of worker needed but not the number.7
The national warning signal: weaker hiring for young workers
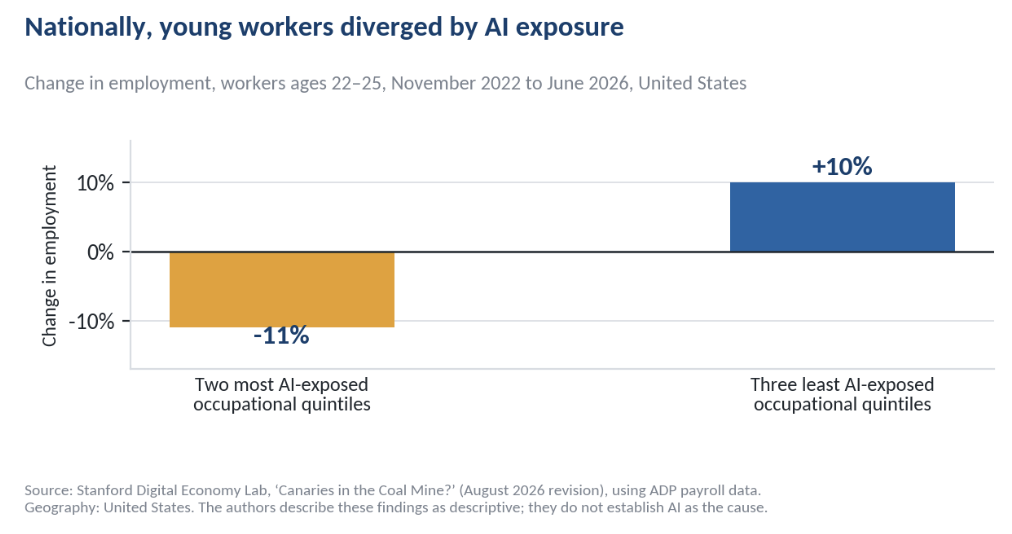
The strongest national evidence comes from Stanford’s Digital Economy Lab. Using ADP payroll records through June 2026, the researchers found that employment among workers ages 22–25 has moved in sharply different directions depending on occupational AI exposure. Employment in the two most-exposed quintiles fell about 11% between November 2022 and June 2026, while employment for the same age group in the three least-exposed quintiles rose about 10%. The adjustment appears primarily in reduced hiring rather than increased separations.2
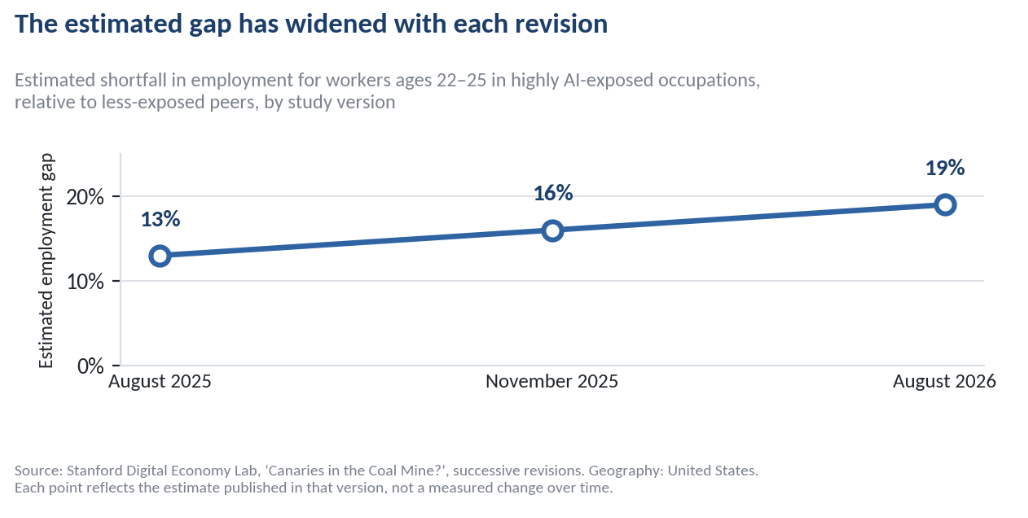
Put another way, as of June 2026 employment among young workers in highly exposed occupations in the United States stood about 19% below where it would have been had it kept pace with less-exposed peers. That estimate has widened across successive revisions of the study. The direction is noteworthy, but so is the sensitivity to new data: the version of the estimate matters.2
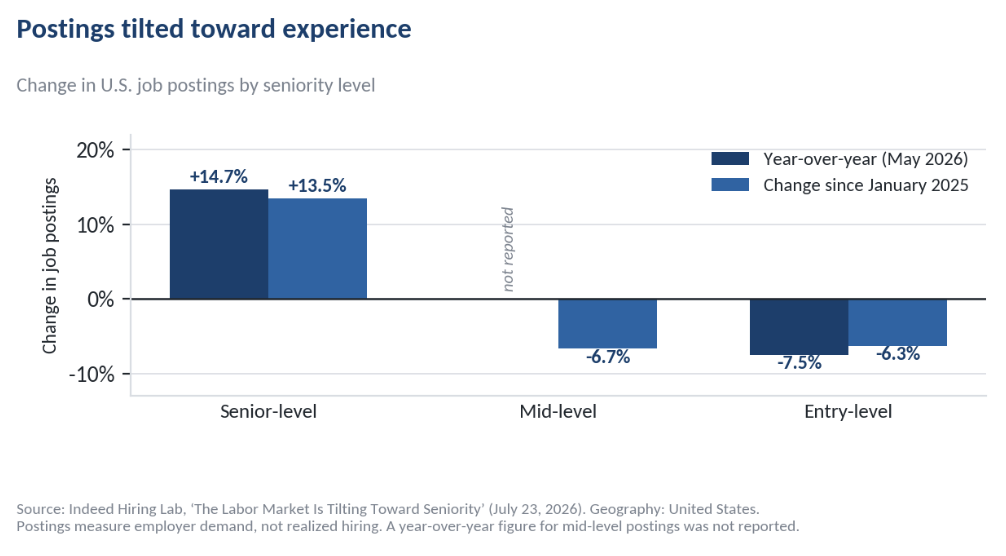
The Stanford result is not isolated. A Harvard working paper covering roughly 62 million U.S. workers across 285,000 firms between 2015 and 2025 also finds that junior employment declined relative to senior employment after firms adopted generative AI, with slower hiring - not greater separations - accounting for most of the change.12 National job-posting data point in the same broad direction: demand has recently shifted toward more senior workers.8
Why AI is only part of the story
The timing, however, works against a simple AI explanation. A New York Fed analysis of United States job postings published in May 2026, combining an AI-usage measure with Lightcast postings and BLS employment data, found that higher-exposure occupations began losing ground before ChatGPT’s late-2022 release and did not show a sharp break afterward. It also found no clear junior-versus-senior divergence within highly exposed occupations. Additionally, the measured exposure itself is concentrated: fewer than 10% of workers and vacancies are in occupations with exposure of at least 0.4, while 40% of workers are in jobs with zero measured exposure.3 Together these findings set a limit on how much generative AI can explain. If the technology directly touches only a narrow slice of the labor market, then even a substantial effect inside that slice would leave most jobs unaffected, and a hiring slowdown that reaches young workers across many occupations cannot rest on AI alone.
Remote work
Researchers at the Federal Reserve Bank of New York have estimated that remote work can explain 64% of the recent rise in unemployment among young college graduates in the United States, comparing 2017–19 with 2022–25.4 The proposed mechanism is not that remote work reduces the amount of work available, but that it changes how junior workers learn. Early-career employees acquire skill largely by proximity: overhearing calls, having drafts corrected, asking small questions that would not justify a scheduled meeting, and watching experienced colleagues handle situations no training manual covers. Distributed teams deliver less of this incidental instruction, which raises the cost of supervising an inexperienced hire. Faced with that cost, employers can reasonably prefer candidates who already work independently, which shifts demand toward people with a few years of experience. On this account the entry point narrows because training became harder and more costly, not because the work disappeared.
The difficulty for this analysis is that remote-capable occupations and AI-exposed occupations are largely the same occupations. A cross-country study of 243 million hires and 407 million job postings across the United States, United Kingdom, Canada, and Australia between 2017 and 2025 found that when both factors are tested together, remote-work capability still predicts weaker early-career hiring, while AI exposure predicts much less of it than it appears to on its own. In other words, among jobs that are equally remote-capable, being more exposed to AI adds little explanatory power as to why junior hiring has weakened.5 However, the Stanford authors reported the opposite for their own data: their young-worker gap remains after they account for remote work. 2 The two findings have not been reconciled; we do not attempt here to adjudicate between them.
The broader hiring slowdown
The broader hiring environment matters as well. When firms create fewer openings overall, workers with the least experience often feel the slowdown first. That mechanism requires no new technology at all, and it fits the chronology: a weak entry-level market can reflect AI, remote work, post-pandemic normalization, and a general low-hire environment at the same time.
The entry point may be changing
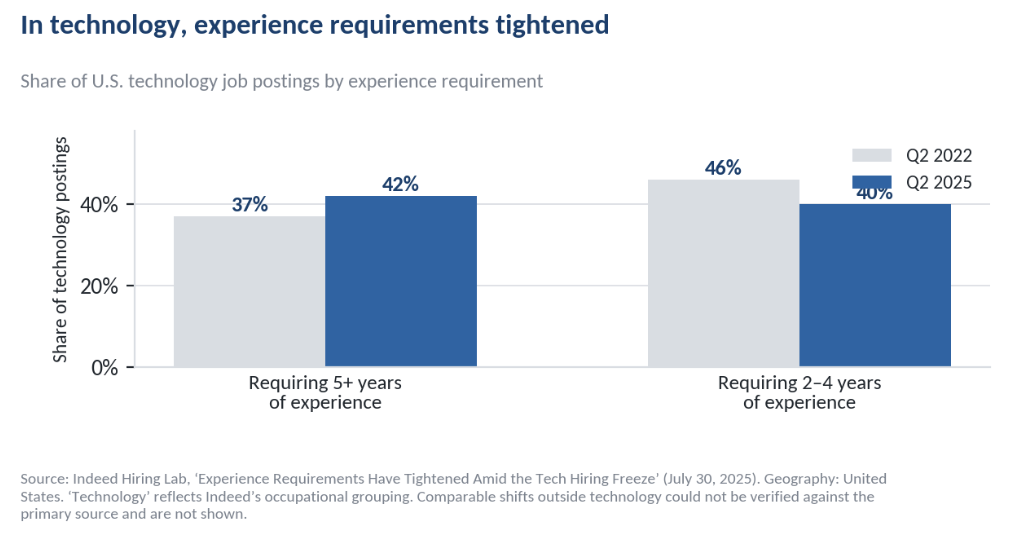
One way the career ladder’s first rung could change is through higher experience requirements, but the verified evidence is narrower than the broad ‘experience inflation’ narrative suggests. Within United States technology postings, the share requiring at least five years of experience rose from 37% to 42% between the second quarters of 2022 and 2025, while the share seeking two to four years declined.9 Comparable shifts outside technology could not be confirmed against the primary source and are therefore not reported here.
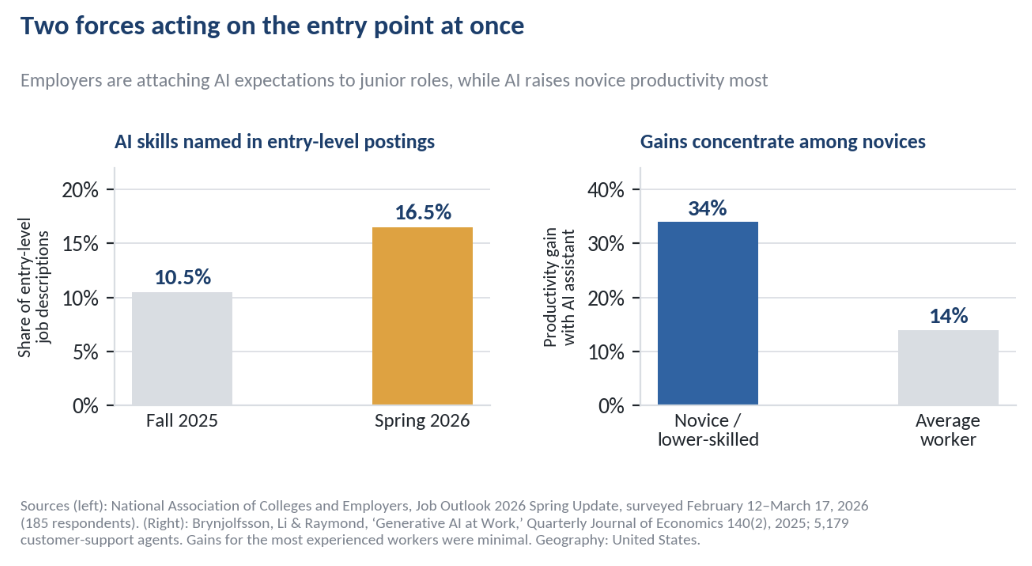
Skill requirements show a clearer shift. The National Association of Colleges and Employers reports that AI-related skills appeared in 10.5% of entry-level job descriptions in fall 2025 and 16.5% by spring 2026; more than one-third of surveyed employers now say their entry-level positions require AI skills.10 Yet the same technology may also make inexperienced workers more valuable. In a study of 5,179 customer-support agents, access to a generative-AI assistant raised productivity by about 14% on average and by 34% among novice and lower-skilled workers, with little effect on the most experienced.11 The implication is not simply fewer entry-level jobs. It may be fewer routine tasks, higher expectations, and a faster path to productivity for the workers who are hired.
Philadelphia’s exposed professional base
While national evidence poses the question, it cannot be used to answer it for this region. In this section, we detail the regional record: how exposed Philadelphia’s occupational base is, which of those occupations are losing employment, where the region’s job growth has come from since 2022, and what employers in the Federal Reserve’s Third District say they are doing.
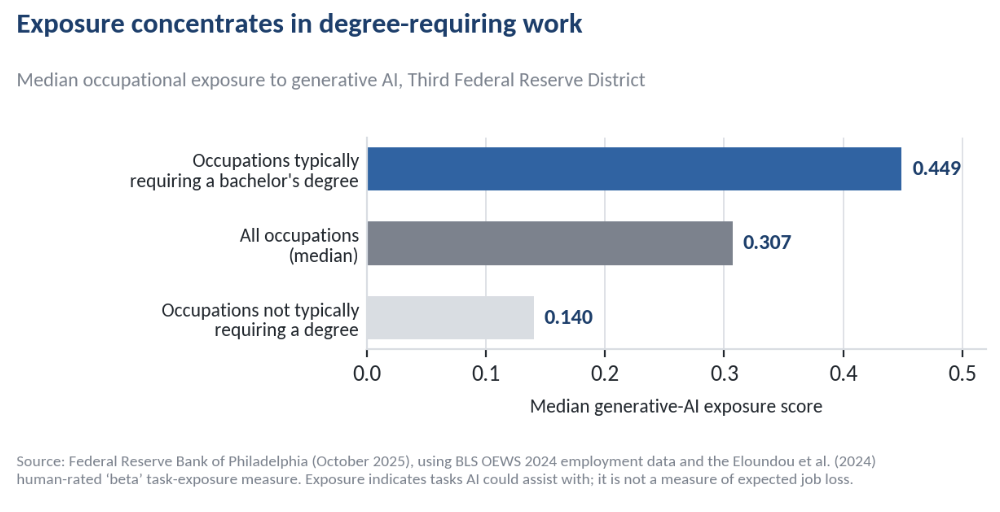
In an October 2025 study, the Federal Reserve Bank of Philadelphia defines occupational exposure as the share of a job’s tasks that large language models and complementary software could complete in at least half the time while preserving quality, using the human-rated measure developed by Eloundou and colleagues. Across metropolitan areas in the 3rd District, the median exposure score is 0.307. For occupations that typically require a bachelor’s degree, the median is more than three times as high as for occupations that do not.1
The regional pattern is striking. Among 3rd District metros in 2024, Trenton-Princeton has the highest share of jobs in the top national exposure quartile at 34%, while State College and Philadelphia-Camden-Wilmington are tied at 25%. Because Philadelphia is much larger, it has the greatest absolute number of exposed jobs in the district. Many of those jobs are also familiar entry points into professional careers, which is why exposure matters here as a career-ladder question rather than simply a technology statistic.1
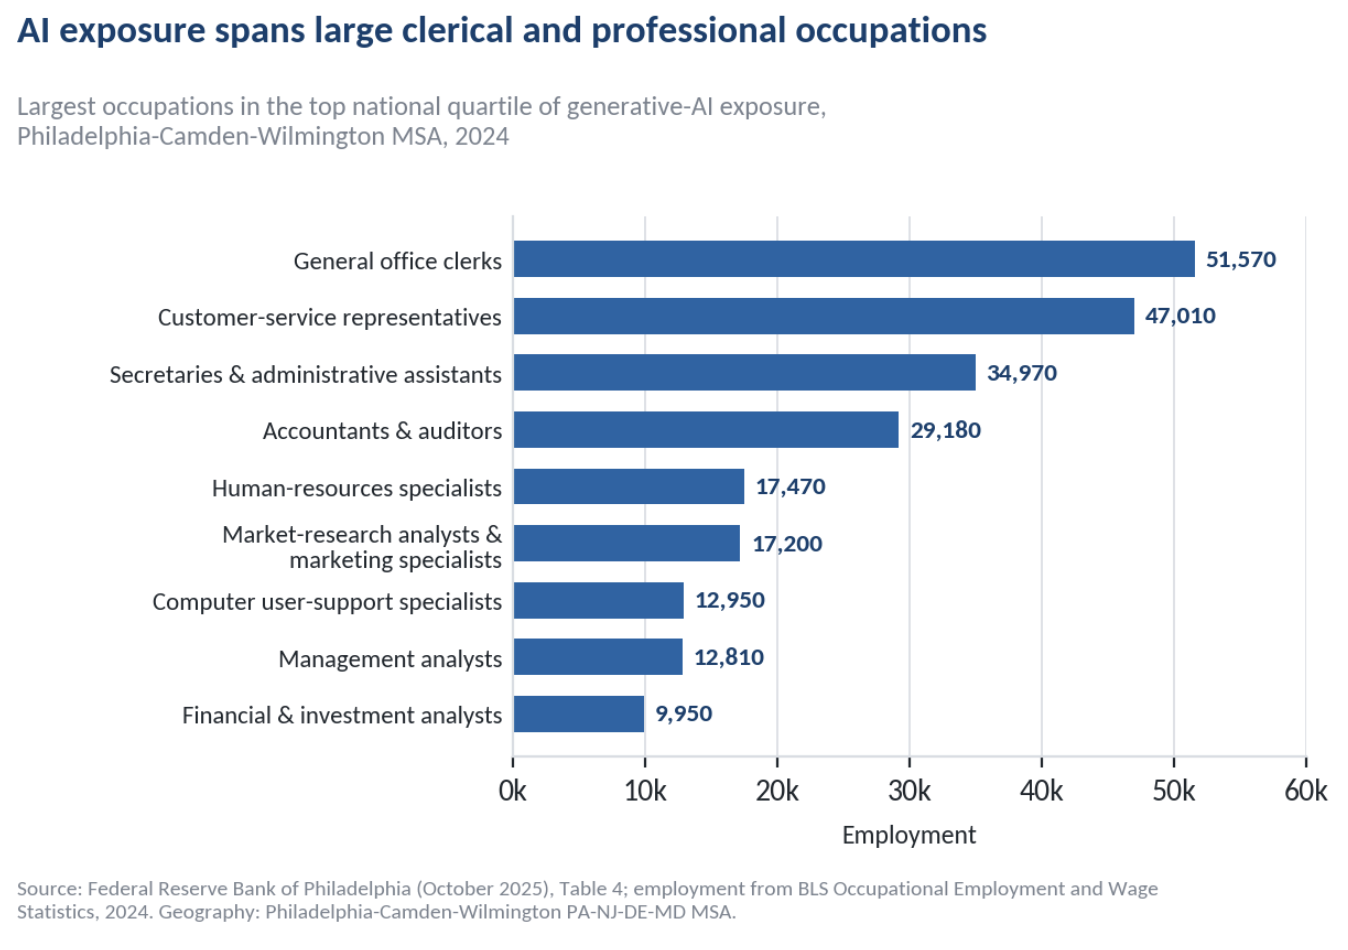
White-collar and office-based work encompass two distinct categories of occupations that are highly exposed to generative AI in Greater Philadelphia. The first is clerical and administrative work — general office clerks, customer-service representatives, secretaries and administrative assistants, and bookkeeping clerks. The second is professional and analytical work — accountants and auditors, management analysts, financial and investment analysts, market-research analysts, and human-resources specialists. The two categories differ substantially in their education requirements, wages, and career pathways, but both contain tasks that generative AI can assist with under the Philadelphia Fed’s measure. That distinction matters because their recent employment trajectories have been notably different.
Philadelphia’s clearest local warning sign: office work
The clearest local trend is the shrinking employment share of office and administrative support work. These occupations accounted for 12.5% of Philadelphia-Camden-Wilmington MSA employment in May 2023, 11.9% in May 2024, and 11.1% in May 2025 — 320,580 of 2,897,830 jobs.6 Between May 2024 and May 2025 the region lost 11.5% of its general office clerks and 11.2% of its customer-service representatives, while secretaries and administrative assistants fell 6.1%.6
What makes the pattern more revealing is what happened elsewhere among occupations with similarly high AI exposure. Most of the professional and analytical occupations in this group did not decline over the same period: accountants and auditors rose 0.7%, financial and investment analysts 1.0%, and market-research analysts 2.3%. Computer user-support specialists were essentially flat, while management analysts rose 20.7%. Human-resources specialists were the notable exception, falling 8.4%.6
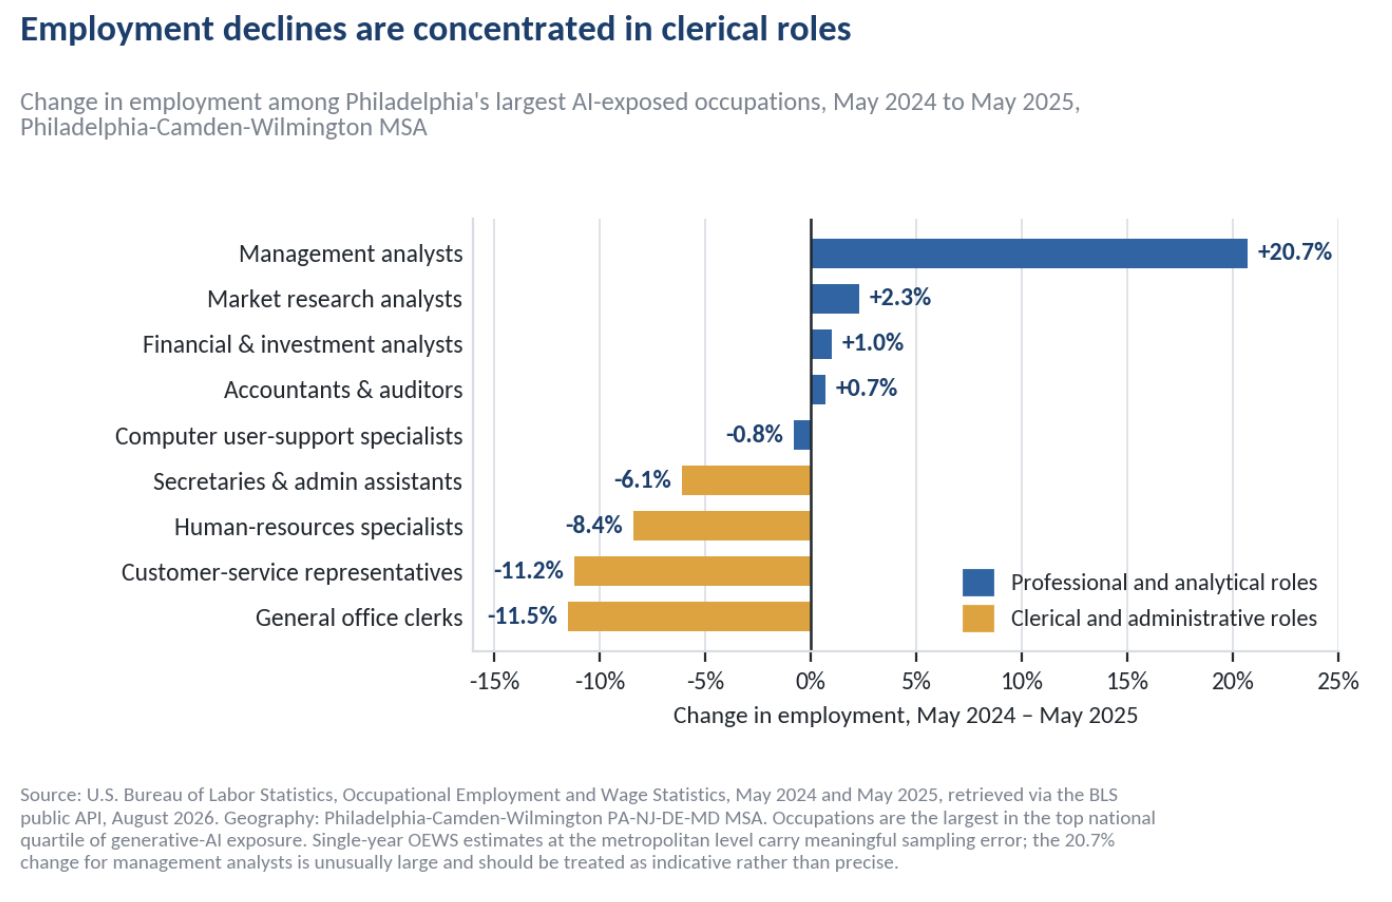
The contrast is important. The occupations losing employment are concentrated in clerical and administrative work, while most of the professional and analytical occupations shown here remained stable or grew despite also ranking highly on the Philadelphia Fed’s AI-exposure measure. Human resources is an exception, underscoring that the boundary between routine and analytical work can run within occupations as well as between them.
That pattern also complicates a simple AI-displacement explanation. If measured exposure alone were driving employment change, we might expect weakness to be more broadly distributed across the highly exposed occupations. Instead, the clearest losses are concentrated in clerical work — a part of the labor market that had already been reshaped for years by enterprise software, self-service systems, offshoring, and other forms of automation. Generative AI may be accelerating that longer-running transition, but the local data do not support the notion that the trend started with AI.
Wherein Philadelphia’s actual job growth?
Occupations are only one way to look at the labor market. A broader question is whether the sectors that employ much of Philadelphia’s white-collar workforce are themselves expanding.
Greater Philadelphia’s own employment record, drawn directly from the Bureau of Labor Statistics, shows that between June 2022 and June 2026, the Philadelphia-Camden-Wilmington metropolitan area added 149,200 jobs. Education and health services accounted for 101,700 of them — 68% of all net job growth. Over the same four years, professional and business services added just 3,500 jobs, or 0.7%; financial activities added 700, or 0.3%; and information lost 4,300 jobs, a decline of 7.9%.16
These sectors capture very different parts of the regional economy - Education and health services includes the region’s hospitals and universities; Professional and business services spans law, accounting, consulting, engineering, architecture, advertising, computer services, staffing, and administrative support; Financial activities includes banking, asset management, insurance, and real estate, while Information includes telecommunications, broadcasting, publishing, and software.
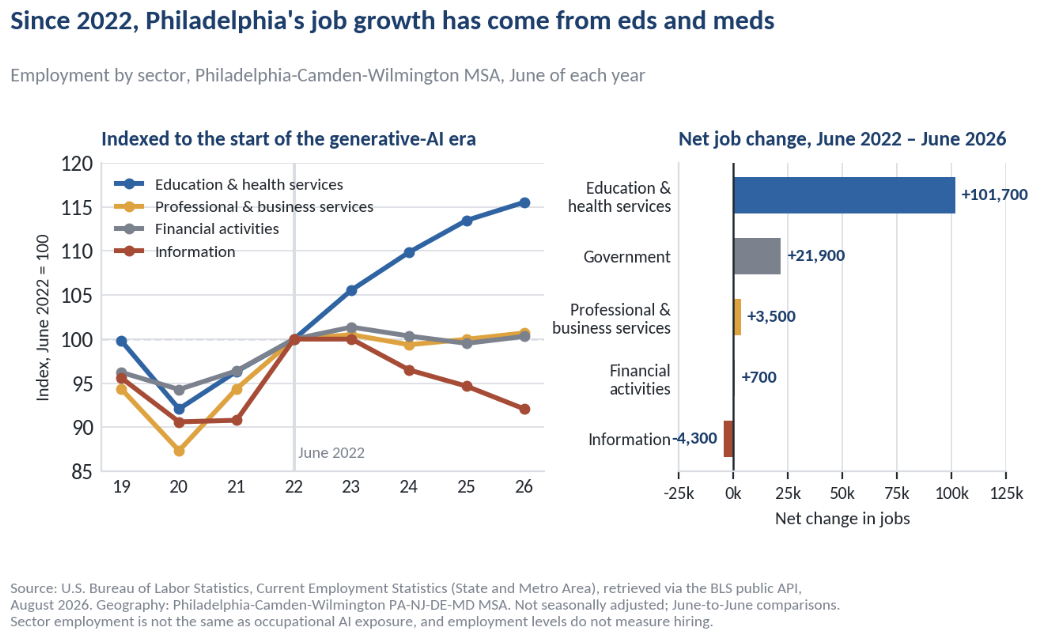
The aggregate figure also understates what happened to professional work specifically. In the Philadelphia MSA, professional and business services contains three distinct components. Within these services, the two components most relevant to this analysis moved in different directions. Professional, scientific, and technical services — the law firms, accounting practices, consultancies, engineering and design firms, and computer-services companies that make up the region’s white-collar core — fell 1.1% between June 2022 and June 2026. Administrative and support services, a lower-wage category that includes staffing agencies, call centres, and building services, grew 3.1% over the same period. The flat headline therefore conceals a decline in the professional core, offset by growth in support work.16
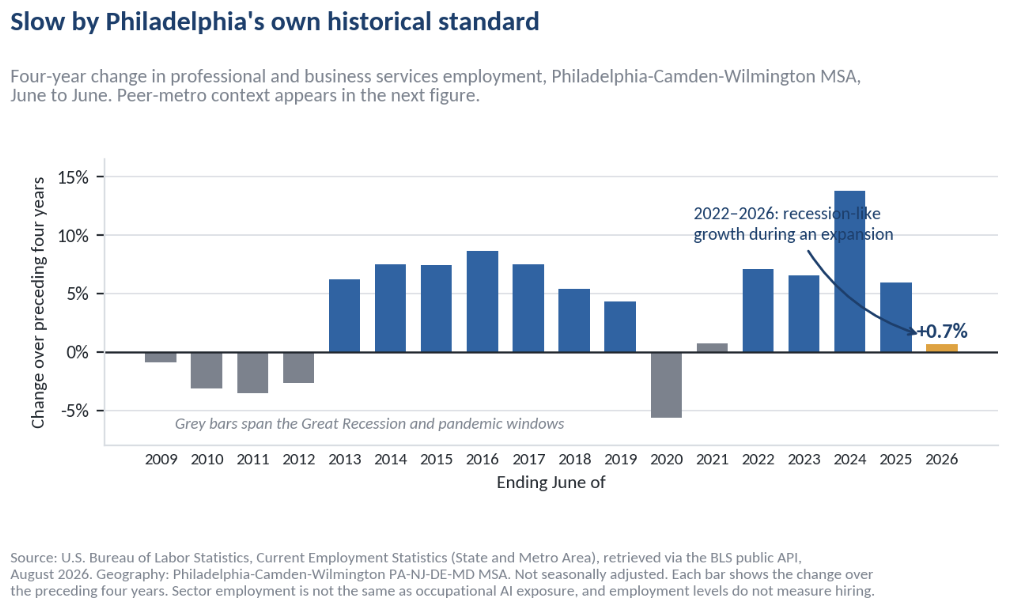
Set against the Philadelphia MSA’s own history, the June 2022 to June 2026 slowdown in professional and business services is pronounced. In the twenty years for which comparable data exist, the only four-year windows with weaker growth span the Great Recession and the pandemic. This one occurred during an economic expansion, as total regional employment grew 5.0%.16
That might appear to strengthen the case that something unusual is happening to white-collar work. But comparison with other metropolitan areas complicates that interpretation.
Professional and business services employment declined in seven of nine comparison metros between June 2022 and June 2026. Philadelphia’s essentially flat result ranked second among the ten metros, behind only New York. 16 The steepest declines occurred in San Francisco, down 10.3%, and San Jose, down 6.0%.
That comparison is an important check on the AI hypothesis. San Francisco and San Jose are among the country’s most AI-intensive economies, so their declines are consistent with the possibility that generative AI is affecting demand for some forms of professional work. But they are equally consistent with the post-pandemic correction in technology employment, higher interest rates, and a broader national slowdown in white-collar hiring. Philadelphia’s relative performance makes it difficult to argue that the region is experiencing an unusually severe AI-driven contraction.
More importantly, sector employment cannot tell us whether the first rung of the career ladder is narrowing. Employment is a stock, while hiring is a flow: a sector can maintain roughly the same number of workers while substantially reducing the number of new people it brings in. And sectors are not occupations. Professional and business services contains jobs with both high and low AI exposure, while highly exposed clerical and analytical occupations are spread throughout the economy, including health care and education.
The nine largest exposed occupations identified by the Philadelphia Fed alone account for roughly 233,000 jobs — about one in fourteen jobs in the metropolitan area. 1
The sector data therefore sharpen rather than settle the question. Greater Philadelphia is still adding jobs, but most of that growth is coming from education and health care. Its broader professional economy has slowed sharply — though no more than in most comparable metros. To understand whether the career ladder itself is changing, we have to look at who firms are hiring, not simply how many workers they employ.
Employers report redesign more often than reduction
Employer reports add an important counterweight. The Philadelphia Fed surveyed 95 firms across the Third Federal Reserve District between October 27 and 31, 2025. Nearly three-quarters reported using some form of AI, and about half were using generative AI. The sample is small, covers the broader district rather than the Philadelphia MSA alone, and records what employers say rather than measured outcomes. Even with those caveats, the pattern is more consistent with redesign than broad displacement.7
Why the first rung matters for Greater Philadelphia
The first rung of the career ladder matters especially in Greater Philadelphia because the region’s economic strategy depends heavily on converting education into career opportunity. Greater Philadelphia has roughly 130 postsecondary institutions and retains about half of its college graduates. Between 2000 and 2021, the number of college-educated residents ages 25–34 in the City of Philadelphia rose 155%, to 152,500.13 The geographies differ - the growth figure is city-level, while the institution and retention figures are regional - but the underlying point is the same: the region has built a large pipeline of educated workers.
That pipeline depends on employers continuing to provide the work through which inexperienced people become experienced. A region can have strong universities, a growing educated population, and stable overall employment while access to its highest-value occupations quietly narrows. Senior positions can remain intact even as the routine research, drafting, analysis, coordination, and support work that once prepared people for them becomes scarcer.
What would change this assessment
Because the present evidence is consistent with several explanations, it is worth setting out in advance what would distinguish among them. The following would strengthen the case that generative AI is materially narrowing the entry point to professional work in Greater Philadelphia:
- Hiring of workers ages 22–34 in professional and technical services, finance, and information falls relative to hiring of workers 35 and older in the same industries for three or more consecutive quarters, while hiring in education and health services holds steady.
- Entry-level postings in the Philadelphia MSA decline faster than senior postings within the same occupations, rather than across the board.
- Occupational employment declines concentrate in high-exposure occupations across sectors, rather than in cyclically sensitive sectors regardless of exposure.
- Firms reporting a change in the type of worker needed also report reduced junior intake when surveyed directly.
The following would weaken it:
- Professional-services employment recovers across peer metros as interest rates ease, indicating the 2022–2026 slowdown was cyclical.
- Junior and senior hiring continue to move together within exposed occupations, as the New York Fed’s postings analysis currently finds.
- Entry-level hiring weakens as much in low-exposure occupations as in high-exposure ones.
- Employers adopting AI most intensively show stable or rising junior headcount.
Greater Philadelphia does not yet show clear evidence of an AI-driven collapse in entry-level professional work. Its overall labor market continues to add jobs, most highly exposed professional occupations have remained stable or grown, and Third District employers report changing workforce needs more often than reducing headcount.
But the warning signs are real. Clerical work is shrinking, the region’s professional and business services sector has barely grown since 2022, and national evidence increasingly points to weaker hiring for young workers in AI-exposed occupations. None of those facts establishes AI as the cause. Together, however, they suggest that the first effects of the technology may appear not in mass layoffs, but in who gets hired, for what work, and with how much experience expected on day one.
For Greater Philadelphia, that is the indicator to watch. A region that succeeds at producing and attracting talent also has to keep creating the opportunities through which inexperienced workers become experienced ones.
The measurement gap
Public data can show hiring by age and industry, but no public source reports metropolitan job-posting experience requirements by occupation. A single Philadelphia MSA extract for 2019, 2022, 2024, and 2026 across early-career occupations would fill the biggest gap in this brief: whether junior openings are becoming scarcer or more demanding within the region itself.
Reference table
Every figure used in this brief, with geography and period. Note numbers correspond to the sources that follow.
| Indicator | Value | Geography | Period | Note |
|---|---|---|---|---|
| Jobs in top national quartile of generative-AI exposure | 25% | Philadelphia-Camden-Wilmington MSA | 2024 data; published Oct. 2025 | 1 |
| Median exposure, occupations requiring a bachelor’s degree | 0.449 | Third Federal Reserve District | 2025 | 1 |
| Median exposure, occupations not requiring a degree | 0.140 | Third Federal Reserve District | 2025 | 1 |
| Employment change, ages 22–25, most-exposed quintiles | −11% | United States | Nov. 2022 – Jun. 2026 | 2 |
| Employment change, ages 22–25, least-exposed quintiles | +10% | United States | Nov. 2022 – Jun. 2026 | 2 |
| Estimated employment gap, ages 22–25, exposed occupations | 19% | United States | Aug. 2026 revision | 2 |
| Share of adopting firms reporting no change in worker numbers | 70% | Third Federal Reserve District | Surveyed Oct. 27–31, 2025 | 7 |
| Share reporting a change in worker type, not number | 17% | Third Federal Reserve District | Surveyed Oct. 27–31, 2025 | 7 |
| Entry-level job postings, year-over-year change | −7.5% | United States | May 2026 | 8 |
| Senior-level job postings, year-over-year change | +14.7% | United States | May 2026 | 8 |
| Technology postings requiring 5+ years of experience | 37% → 42% | United States | Q2 2022 – Q2 2025 | 9 |
| AI skills named in entry-level job descriptions | 10.5% → 16.5% | United States | Fall 2025 – Spring 2026 | 10 |
| Productivity gain from AI assistant, novice workers | 34% | United States | Field study, 2025 | 11 |
| Office and administrative support, share of employment | 12.5% → 11.9% | Philadelphia-Camden-Wilmington MSA | May 2023 – May 2024 | 6 |
| Professional & business services employment change | +0.7% | Philadelphia-Camden-Wilmington MSA | Jun. 2022 – Jun. 2026 | 16 |
| Professional & business services, prior three years | +6.0% | Philadelphia-Camden-Wilmington MSA | Jun. 2019 – Jun. 2022 | 16 |
| Information sector employment change | −7.9% | Philadelphia-Camden-Wilmington MSA | Jun. 2022 – Jun. 2026 | 16 |
| Education & health services, net new jobs | +101,700 | Philadelphia-Camden-Wilmington MSA | Jun. 2022 – Jun. 2026 | 16 |
| Total net new jobs, all sectors | +149,200 | Philadelphia-Camden-Wilmington MSA | Jun. 2022 – Jun. 2026 | 16 |
| Rank among ten metros, professional services growth | 2nd of 10 | Selected U.S. metro areas | Jun. 2022 – Jun. 2026 | 16 |
| Total nonfarm employment | 3,162,100 | Philadelphia-Camden-Wilmington MSA | Jun. 2026 (not seas. adj.) | 16 |
| Unemployment rate | 4.1% | Philadelphia-Camden-Wilmington MSA | Jun. 2026 (not seas. adj.) | 16 |
Methodology and limitations
This brief draws on Federal Reserve research, peer-reviewed and working-paper studies, federal statistical data, and named regional reports. Every statistic is labeled by geography - Philadelphia-Camden-Wilmington MSA, Third Federal Reserve District, City of Philadelphia, or United States - and by period. Those geographies are not interchangeable, and the figures should not be combined or substituted across them.
Four distinctions guide the analysis. Exposure is not displacement. Employment is a stock while hiring is a flow. Correlation is not causation, and none of the studies cited establishes generative AI as the cause of observed labor-market changes in Greater Philadelphia. Finally, employer surveys record what firms say; they are not the same as measured labor-market outcomes.
Single-year occupational estimates at the metropolitan level carry sampling error and are best read as indicative rather than exact. Two studies cited here - Hosseini and Lichtinger, and Lambert and Schindler - are working papers that have not been peer-reviewed. The national findings on young-worker hiring also remain contested, and key estimates have changed materially as new data have been added.
Notes
- 1. Federal Reserve Bank of Philadelphia. Adam Scavette, Danielle Jenkins & Lei Ding, “Occupational Exposure to Generative Artificial Intelligence in the Third Federal Reserve District.” October 2025. Geography: Third Federal Reserve District metropolitan areas. Employment data: BLS Occupational Employment and Wage Statistics, 2024. Exposure measure: Eloundou et al. (2024).
https://www.philadelphiafed.org/community-development/workforce-and-economic-development/occupational-exposure-to-generative-artificial-intelligence-in-the-third-federal-reserve-district - 2. Stanford Digital Economy Lab. Erik Brynjolfsson, Bharat Chandar & Ruyu Chen, “Canaries in the Coal Mine? Six Facts about the Recent Employment Effects of Artificial Intelligence.” August 2026 revision (original August 2025). Geography: United States. Data: ADP payroll records through June 2026.
https://digitaleconomy.stanford.edu/app/uploads/2026/08/Canaries_August2026.pdf - 3. Federal Reserve Bank of New York. Richard Audoly, Miles Guerin & Giorgio Topa, “Do Job Postings Show Early Labor-Market Effects of AI?” Liberty Street Economics, May 14, 2026. DOI 10.59576/lse.20260514. Geography: United States. Data: Lightcast job postings; Anthropic-based exposure measure.
https://libertystreeteconomics.newyorkfed.org/2026/05/do-job-postings-show-early-labor-market-effects-of-ai/ - 4. Federal Reserve Bank of New York. Natalia Emanuel, Emma Harrington & Amanda Pallais, “Remote Work Leaves Younger Workers Sidelined.” Liberty Street Economics, June 1, 2026. Geography: United States. Data: Current Population Survey, 2017–19 compared with 2022–25.
https://libertystreeteconomics.newyorkfed.org/2026/06/remote-work-leaves-younger-workers-sidelined/ - 5. Peter John Lambert & Yannick Schindler, “The Broken Ladder: AI, Remote Work, and Early-Career Hiring.” CAGE Working Paper 808/2026; CEP Discussion Paper dp2193. Geography: United States, United Kingdom, Canada, Australia, 2017–2025. Working paper; not peer-reviewed.
https://papers.ssrn.com/sol3/papers.cfm?abstract_id=6787638 - 6. U.S. Bureau of Labor Statistics, Occupational Employment and Wage Statistics, “Occupational Employment and Wages in Philadelphia-Camden-Wilmington.” Geography: Philadelphia-Camden-Wilmington PA-NJ-DE-MD MSA. Shares of 12.5% (May 2023) and 11.9% (May 2024) confirmed in BLS Mid-Atlantic releases.
https://www.bls.gov/regions/mid-atlantic/news-release/occupationalemploymentandwages_philadelphia.htm - 7. Federal Reserve Bank of Philadelphia. Adam Scavette & Theresa Dunne, “Has Generative Artificial Intelligence Adoption Impacted Labor Demand at Third District Firms?” February 3, 2026. Survey fielded October 27–31, 2025; 95 responding firms, 48 generative-AI adopters. Geography: Third Federal Reserve District.
https://www.philadelphiafed.org/community-development/workforce-and-economic-development/has-generative-artificial-intelligence-adoption-impacted-labor-demand-at-third-district-firms - 8. Indeed Hiring Lab, “The Labor Market Is Tilting Toward Seniority.” July 23, 2026. Geography: United States. Data: Indeed job postings, as of May 2026 and relative to January 2025.
https://hiringlab.indeed.com/2026/07/23/the-labor-market-is-tilting-toward-seniority/ - 9. Indeed Hiring Lab, “Experience Requirements Have Tightened Amid the Tech Hiring Freeze.” July 30, 2025. Geography: United States. Data: technology job postings, Q2 2022 – Q2 2025.
https://www.hiringlab.org/2025/07/30/experience-requirements-have-tightened-amid-the-tech-hiring-freeze/ - 10. National Association of Colleges and Employers, “Job Outlook 2026 Spring Update.” Surveyed February 12 – March 17, 2026; 185 respondents. Geography: United States.
https://www.naceweb.org/research/reports/2026/job-outlook/spring-update/ - 11. Erik Brynjolfsson, Danielle Li & Lindsey Raymond, “Generative AI at Work.” Quarterly Journal of Economics 140(2), May 2025, pp. 889–942. DOI 10.1093/qje/qjae044. NBER Working Paper 31161. Geography: United States; 5,179 customer-support agents. The published article reports a 15% average gain; the widely cited working paper reports 14%.
https://academic.oup.com/qje/article/140/2/889/7990658 - 12. Seyed Mahdi Hosseini Maasoum & Guy Lichtinger, “Generative AI as Seniority-Biased Technological Change: Evidence from U.S. Résumé and Job Posting Data.” Working paper, August 2025. Geography: United States; approximately 62 million workers across 285,000 firms, 2015–2025. Not peer-reviewed.
https://papers.ssrn.com/sol3/papers.cfm?abstract_id=5425555 - 13. Campus Philly with Econsult Solutions, “Philadelphia Momentum: Leveraging College Graduate Retention for Continued Growth in Greater Philadelphia.” September 2023. Geographies as noted in text: City of Philadelphia for the 155% growth figure; Greater Philadelphia region for retention and institution counts.
https://campusphilly.org/wp-content/uploads/2023/09/Philadelphia-Momentum_Campus-Philly_2023-09-14_FINAL.pdf - 14. U.S. Bureau of Labor Statistics, Current Employment Statistics (State and Metro Area), and Pennsylvania Center for Workforce Information & Analysis. Geography: Philadelphia-Camden-Wilmington PA-NJ-DE-MD MSA; total nonfarm employment 3,151,100 in May 2026, not seasonally adjusted.
https://www.bls.gov/regions/mid-atlantic/summary/BLSSummary_Philadelphia.pdf - 15. U.S. Census Bureau, Quarterly Workforce Indicators. New hires by age band (including 22–24 and 25–34) and industry, available at metropolitan level with an approximate two-quarter lag.
https://qwiexplorer.ces.census.gov/ - 16. U.S. Bureau of Labor Statistics, Current Employment Statistics (State and Metro Area) and Local Area Unemployment Statistics, retrieved directly via the BLS public API in August 2026. Geography: Philadelphia-Camden-Wilmington PA-NJ-DE-MD MSA and the comparison metropolitan areas named in the text. Series include SMU42379800000000001 (total nonfarm), SMU42379806000000001 (professional and business services), SMU42379806500000001 (education and health services), SMU42379805000000001 (information), SMU42379805500000001 (financial activities), and LAUMT423798000000003 (unemployment rate). Not seasonally adjusted; all comparisons are June to June. Sector employment does not correspond to occupational AI exposure, and employment levels do not measure hiring. Figures in this brief derived from these series are Economy League calculations.
https://www.bls.gov/sae/

