11. Macro Indicators: Who’s Working in Philadelphia? A Look at Employment Gains by Gender across Industries Since 2010 (Gender – Part II)
Date: July 10th, 2025
Written by: Ziqi Zhou, Alex Nadol, Saloni Tandon
This Leading Indicator builds directly on our previous gender employment analysis of Philadelphia's workforce transformation from 2010 to 2023.
Part I of the series revealed that while both men and women experienced substantial employment gains—with male employment rising from 59.6% to 75.2% and female employment increasing from 59% to 72.6%—the gender gap persisted and actually widened from 0.6 to 2.6 percentage points over the period. Despite women's higher educational attainment and Philadelphia's overall addition of 379,200 jobs, structural barriers including childcare access challenges and wage disparities have been noted to create employment disadvantages for females that wanted to work.
Building on those findings, this Part II edition of the Leading Indicators expands the analysis to examine how gender employment patterns vary across sub-industries over the same 2010–2023 period. By analyzing sub-industry-specific employment data and comparing against peer cities—Chicago, Detroit, and Pittsburgh—we assess whether Philadelphia's gender employment disparities are uniform across all industries or concentrated in particular sectors. In other words, are the structural advantages favoring male workers evident across Philadelphia's entire economy, or do certain industries demonstrate more equitable gender employment patterns?
What You Need to Know
For Philadelphia:
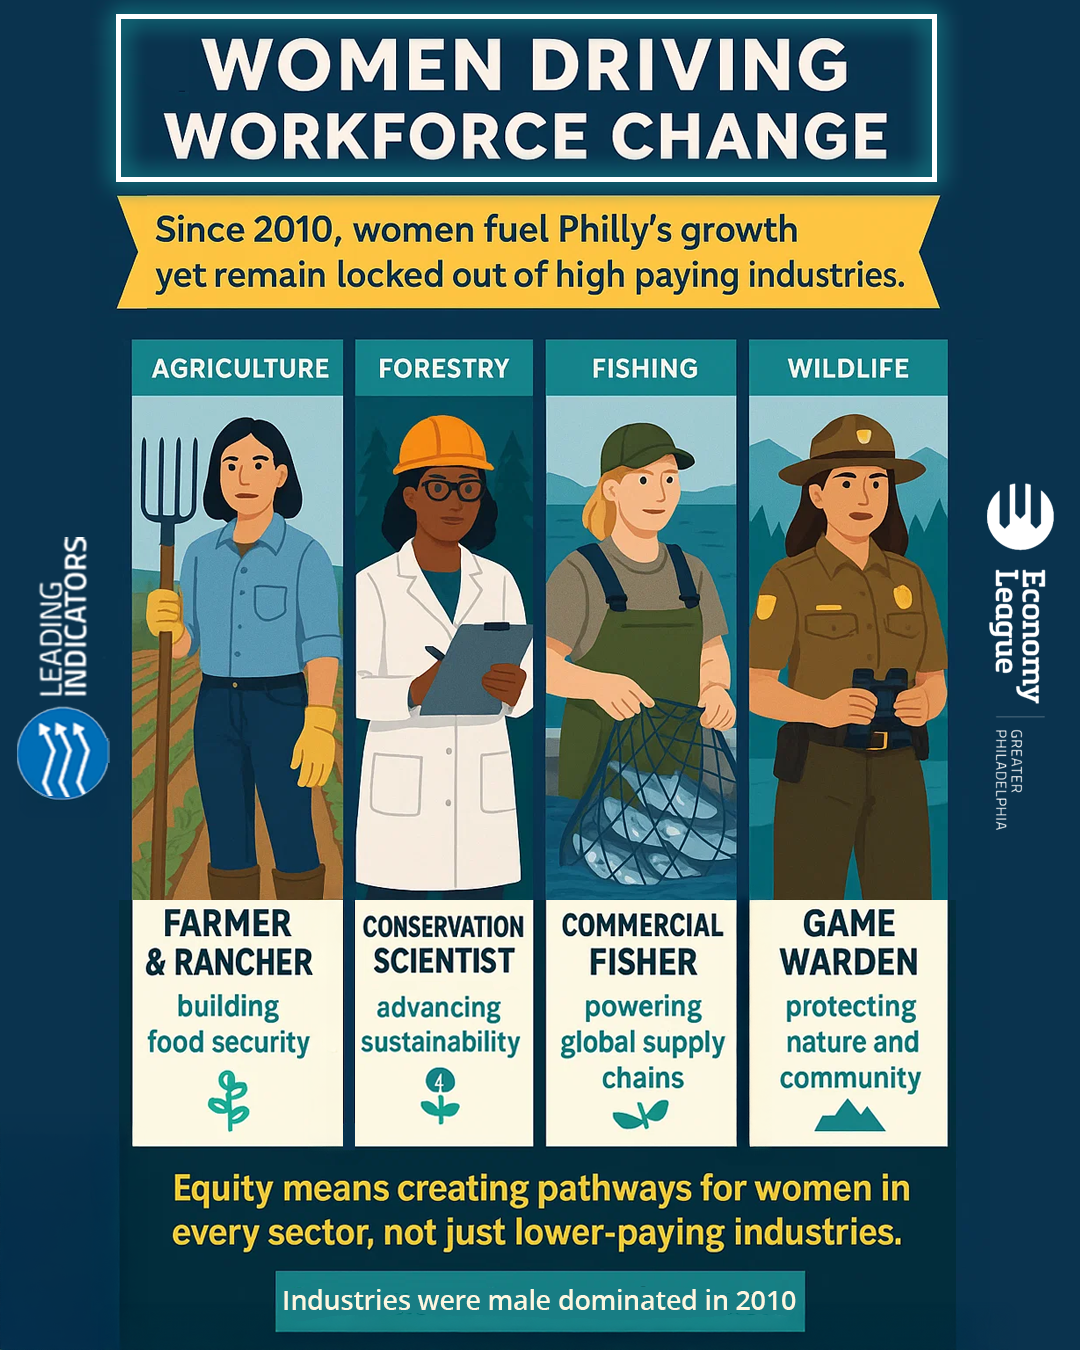
- Multiple industries that were male dominated in 2010 have shifted patterns and now reflect more female representation in their workforce, with the most dramatic transformation shown in Agriculture, Forestry, Fishing and Hunting (female share surged 11.4 percentage points to 35.97%), with gradual gains in Manufacturing and Construction – which nevertheless remained male-dominated.
- The opposite trend was observed in Finance. The workforce in Finance and Insurance became more male, becoming nearly gender-balanced at 49.34% male by 2023.
- Mixed Salary Equity Results: Philadelphia achieved notable wage gap reductions in industries like Retail Trade, which narrowed the gap from 42.2% in 2010 to 29.6% in 2023. However, the city also experienced wage gap widening in industries like Information, which increased from 29.5% in 2010 to 30.6% in 2023.
- Concerning Wage Trends: Despite growing female participation in some historically male-dominated industries, wage gaps widened in sectors like Agriculture, Forestry, Fishing and Hunting, indicating that employment gains don't automatically translate to pay equity.
Meanwhile in other cities:
- Similar female participation declines in Finance and Insurance: the other three peer cities also experienced 5–7 percentage point drops in female representation, with Detroit declining the most at 6.84 percentage points.
- Pittsburgh as an outlier in Information sector: experienced an 8.4 percentage point decline in female representation while Philadelphia, Chicago, and Detroit all posted modest 1–2 percentage point gains.
- Mining showed extreme regional variation: Pittsburgh surged 9.7 percentage points while Detroit collapsed by 21.86 percentage points, and Philadelphia and Chicago saw minimal increases.
- Educational Services/Health Care and Construction showed regional consistency: all cities maintained similar patterns with 72–73% female majorities in education/healthcare and modest 2–3 percentage point female gains in male-dominated construction.
Industry-Wise Gender Analysis for Employment
When looking specifically at gender-based employment patterns by industry in Philadelphia and its peer cities, we find significant shifts toward greater female representation in traditionally male-dominated industries, alongside persistent but narrowing gender pay gaps. In this industry-specific analysis, we use the metric “gender composition” instead of “employment rate” as the analysis Part I used. Significantly different from the “employment rate” which represents the percentage of the selected population that is currently employed (denominator being the total population employed, numerator is the selected gender), the “Gender distribution/Composition within each industry” refers to the representation of female versus total employed workers in a specific industry (denominator being the population employed in the sector only). This is owing to a lack of data following the same base.
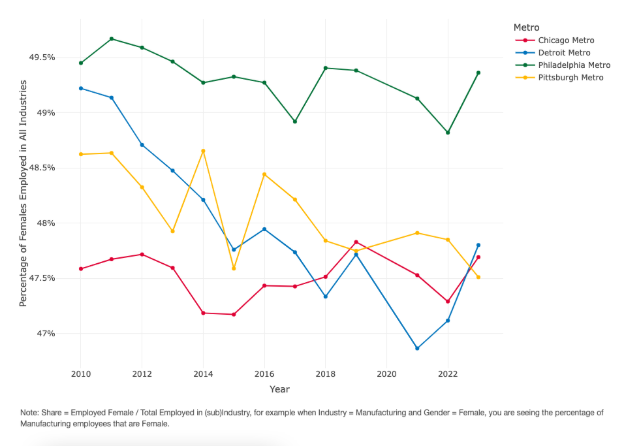
Philadelphia's Overall Gender-based Share of Labor Force by Industry (2010–2023)
Between 2010 and 2023, most industries in Philadelphia have experienced employment composition shifts toward greater female representation, especially amongst industries that have traditionally been male dominated. The most dramatic transformation occurred in the sub-industry Agriculture, Forestry, Fishing and Hunting, where the female representation surged from 24.57% to 35.97%, representing a substantial 11.4 percentage point increase. Wholesale Trade and subindustry Utilities also showed notable increase in female representation. In specific, Wholesale Trade reached a 5.8 percentage point increase from 28.15% in 2010 to 33.93% in 2023, and Utilities achieved a 4.3 percentage point increase from 17.82% to 22.12%. Manufacturing and Construction, while remaining male-dominated, showed gradual but consistent female advancement. Manufacturing saw female representation grow from 31.0% to 33.7% (a 2.6 percentage point increase), while Construction increased from 7.9% to 10.4% (a 2.5 percentage point increase).
Meanwhile, some industries moved in the opposite direction. Finance and Insurance as a sub-industry experienced male gains, with male representation increasing from 44.06% to 49.34%, making this sector nearly gender-balanced. Notably, these industries are also the ones that normally require relatively higher education attainment.
For the larger industry of Educational Services, Health Care and Social Assistance, female dominance remained consistent, maintaining approximately 73% female representation with minimal change since 2010. In specific, by 2023, females constituted 66.26% in Educational Services and 76.38% in Healthcare and Social Assistance as sub-industries.
Comparison with Chicago, Detroit and Pittsburgh
When comparing Philadelphia's labor force trends with Chicago, Detroit, and Pittsburgh, several distinctive patterns emerge that highlight Philadelphia's unique position among major Rust Belt metropolitan areas — regions that were once the center of manufacturing, steelmaking, and coal-producing.
- From 2010 to 2023, Philadelphia significantly outpaced all peer cities in female advancement within traditionally male-dominated primary industries such as Agriculture, Forestry, Fishing and Hunting, achieving an 11.4 percentage point increase compared to Detroit's increase by 4.73 percentage points, Chicago's decline of 0.46 percentage points, and a decline in Pittsburgh's female representation by 10.63 percentage points.
- Across cities, the participation of women in the Finance and Insurance sub-industry has declined considerably since 2010. In specific:
- Philadelphia experienced a 5.28 percentage point decline from 55.94% in 2010 to 50.66% in 2023,
- Chicago experienced a decline of 5.84 percentage points from 53.49% to 47.65%,
- Detroit declined the most among the four cities with 6.84 percentage points from 63.22% to 56.38%,
- Pittsburgh saw a 5.51 percentage point decline from 59.84% to 54.33%.
- Pittsburgh diverged significantly from the other peer cities in the Information sector, experiencing an 8.4 percentage point decline in female representation, while Philadelphia, Chicago, and Detroit all showed modest female gains of 1–2 percentage points.
- Pittsburgh also came out as the champion for the Mining sub-industry with a 9.7 percentage point increase from 14.66% in 2010 to 23.93% in 2023, while Philadelphia and Chicago experienced minimal increases, and Detroit went through a major decline of 21.86 percentage points. In specific:
- Philadelphia increased its female representation in the Mining sub-industry from 11.59% in 2010 to 13.03% in 2023,
- Chicago increased from 22.94% to 24.31%,
- Detroit decreased significantly from 25.09% to 3.23%.
The table below summarizes the changes in the gender-wage gap across cities since 2010. How to Read the Arrows:
↓ Down Arrow: Indicates that a male- or female-dominated industry became more gender-balanced over time (i.e., the gender gap narrowed).
↑ Up Arrow: Indicates that the industry became more gender-skewed (i.e., the gender gap widened).
→ Straight Arrow: Indicates minimal change—less than 1%—in either direction.
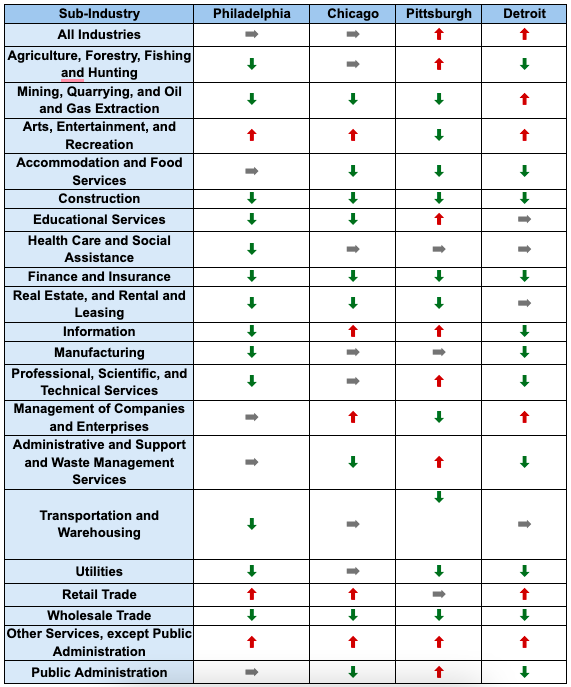
Despite these differences, all four cities showed remarkable similarity in several industries. Educational Services, Health Care and Social Assistance maintained strong female majorities of approximately 72–73% across all four cities with moderate change over the 13-year period. Meanwhile, Construction demonstrated consistent patterns across all cities, with modest female gains of 2–3 percentage points while remaining heavily male-dominated.
Median Salary
Another important metric to look at is the median salary. While the analysis above reveals which industries are becoming more gender-balanced, salary data shows whether this improved share of labor force translates into equitable compensation.
Gender-based Median Salary Trends by Industry (2010–2023)
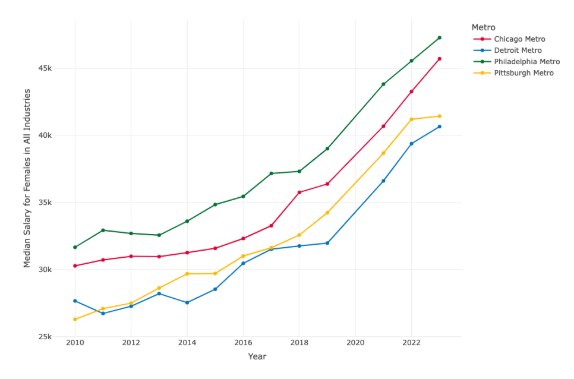
Philadelphia’s salary landscape between 2010 and 2023 reflects strong overall wage growth—but mixed progress on gender equity. During this period, median salaries for women increased by 54% (from $65,041 to $100,106), outpacing the 38.5% growth for men (from $93,849 to $129,996). As a result, the gender pay gap narrowed from 30.7% to 22.9%.
However, a shrinking gap does not equal parity. These figures reflect changes in earnings over time—not equal pay for equal work. They show that women’s incomes have grown faster, but from a lower starting point, and often in different sectors or roles than men. Sector-level differences further complicate the picture, with some industries making greater strides toward equity than others. Understanding these patterns is critical to assessing not just how incomes are rising, but whether they’re rising fairly—and for whom.
The most notable advancements are seen in the subindustry of Mining, Quarrying, and Oil and Gas Extraction, where the female median salaries increased 1.43 times by 2023 (from $32,409 to $79,075). This was in stark comparison with the 83% increase in median salaries for men during the same duration, resulting in the gender gap in salaries reducing from 23% to –2%—where women now earn more than men in this sector. Further, in Real Estate and Rental and Leasing, female median salaries have surged 91.4% from $26,977 to $51,623, significantly exceeding male growth of 43.09% from $41,656 to $59,602 during the same time period. It is critical to note that specific designations of employees within each sector are not available, thereby restricting our ability to do an apples-to-apples comparison. Holistically speaking, however, this change in female median salaries did contribute to a significant reduction in the industry’s gender pay gap from 35.24% in 2010 to 13.38% in 2023.
Finance and Insurance demonstrated the third biggest female advancement, with women's median salaries growing 75.5% from $42,479 to $74,562, substantially outpacing male growth of 52.1% from $68,034 to $103,484. Similarly, subindustry Administrative and Support and Waste Management Services demonstrated the fourth strongest female growth at 71.3% from $23,565 to $40,368, far exceeding male growth of 35.8% from $31,235 to $42,419.
However, some industries experienced concerning trends toward greater inequality. Arts, Entertainment, and Recreation saw an increase in salaries for women by 63.6%, and for men by 82.8% during the period, resulting in a widening of the gender pay gap from 34% to 40%. Information, despite strong growth for both genders—with female median salaries increasing 61.3% from $39,738 to $64,115 and male salaries growing 64.0% from $56,374 to $92,451—actually saw the gender gap widen from 29.5% to 30.6%. Historically male-dominated industries like Agriculture, Forestry, Fishing and Hunting experienced similar patterns, with male salary growth of 50.86% (from $27,120 to $40,914) outpacing female growth of 46.23% (from $20,675 to $30,234), causing the gap to widen from 23.77% to 26.11%.
Gender-based Median Salary Comparison with Chicago, Detroit and Pittsburgh
Philadelphia's salary equity performance showed mixed results when compared to Chicago, Detroit, and Pittsburgh across key industries. In Retail Trade, Philadelphia achieved a notable gender gap reduction of 12.6 percentage points from 2010 to 2023, significantly outperforming other peer cities. Similarly, in Professional, Scientific, Management, Administrative, and Waste Management Services, Philadelphia also achieved an exceptional gap reduction of 9.3 percentage points, exceeding its three other peers.
However, industries like Information revealed concerning patterns, with Philadelphia experiencing a 1.1 percentage point gap widening, though this was modest compared to Chicago's 5.0 percentage point widening and Pittsburgh's 5.2 percentage point widening.
Educational Services, Health Care and Social Assistance showed relatively consistent patterns across all four cities, with moderate gap reductions of 3–4 percentage points regionwide, suggesting that it may have experienced similar equity trends regardless of regional context.
Conclusion
Philadelphia's industry-level employment data from 2010 to 2023 reveals varied patterns in gender workforce participation across sectors. Most industries experienced shifts toward greater female representation, with substantial increases in traditionally male-dominated sectors like Agriculture, Forestry, Fishing and Hunting and Mining. Meanwhile, there are also sectors like Finance and Insurance, Real Estate, and Rental and Leasing that moved toward greater male representation despite requiring higher educational attainment. The data shows wage gap reductions in Retail Trade and Professional, Scientific, Management, Administrative, and Waste Management compared to peer cities, alongside wage gap increases in Information and other sectors despite growing female participation.
These findings highlight the disconnect between employment access and wage equity across industries. The divergent trends—where some sectors show improving gender balance while others experience widening compensation disparities—indicate that employment gains and pay equity operate through different mechanisms. The shift toward male representation in higher-education sectors like Finance, combined with persistent wage gaps in industries with growing female participation, suggests that educational attainment and workforce access do not automatically translate to economic parity.
The industry-specific variations in both employment patterns and wage trends demonstrate that gender employment dynamics operate differently across Philadelphia's economic sectors. Understanding these sector-level differences provides insight into how broader economic expansion affects workforce composition and compensation structures, revealing the complexity of employment equity in a diversified urban economy.
Annexures
Citations:
- WHYY: Philadelphia—America’s Poorest Big City
- Neilsberg: Philadelphia Income by Gender
- Census Data: Philadelphia Individual Earnings (ACS 2023)
- U.S. Census Bureau: Labor Force Glossary
- Bureau of Labor Statistics: Labor Force Definitions
Commonly used definitions:
- Labor Force / Civilian Labor Force: Includes all people classified in the civilian labor force, plus members of the U.S. Armed Forces. The civilian labor force consists of people classified as employed or unemployed.
- Workforce: Includes all people age 16 and older who are classified as either employed or unemployed. Conceptually, it is the number of people either working or actively looking for work.
- Population: All people, male and female, child and adult, living in a given geographic area.
- Civilian Employed: Includes all civilians 16 years and older who were either working during the reference week or temporarily absent from their job due to personal reasons, illness, vacation, etc. Does not include unpaid volunteer work or members of the Armed Forces on active duty.

