9. Macro Indicators: Who’s Working in Philadelphia? A Look at Employment Gains by Race Since 2010
This edition of Leading Indicators extends on our previous demographic analysis of Philadelphia's employment transformation, which examined workforce participation patterns across age groups and educational attainment from 2010 to 2023. The previous analysis revealed notable improvements, including youth employment (16-19 years) with a 72.5% increase and workers with less than high school education experiencing a dramatic 58.2% increase.
Building on those findings, this edition of the Leading Indicators expands the demographic lens to examine employment patterns across race/ethnicity over the same 2010-2023 period. By benchmarking against peer cities Chicago, Detroit, and Pittsburgh, we assess whether Philadelphia's employment gains—which occurred within the context of adding 379,200 jobs between 2010 and 2023—have translated into truly inclusive economic growth that extends beyond age and education to benefit all demographic groups.
What You Need to Know
Philadelphia’s employment rate for people aged 16 and over rose from 48.7% in 2010 to 60.2% in 2023. That’s an increase of 11.5 percentage points—meaning for every 100 individuals in the city, an additional 11 individuals were working in 2023, compared to 2010. In relative terms, that’s a 14.07% increase from where we started.
All racial groups showed meaningful improvement, confirming progress on the path of inclusive economic growth. Especially, as of 2023, Philadelphia’s Hispanic/Latino workers showed the strongest growth with a 34.5% increase, which trailed Chicago’s growth (11.6% increase) but exceeded Detroit’s (2.6% increase). Meanwhile, the 56.3% employment rate of Philadelphia's Black population significantly outperformed Chicago (51.6%), Detroit (47.8%), and Pittsburgh (50.2%).
You can also view the trends and play with the data here!
Race and Ethnicity Employment Patterns
Overall Trends
The employment rate, as defined by the U.S. Census Bureau's American Community Survey (ACS), refers to the proportion of the civilian non-institutional population aged 16 and older that is currently employed, whether full-time or part-time. This rate reflects the share of the total adult population that is working, regardless of whether others are seeking work or not. It differs from the labor force participation rate, which measures the proportion of the population that is either employed or actively seeking employment—that is, those who are actively engaged in the labor market. By contrast, the employment rate excludes both the unemployed and those not in the labor force, such as students, retirees, or discouraged workers, offering a more direct picture of actual employment levels across the population.
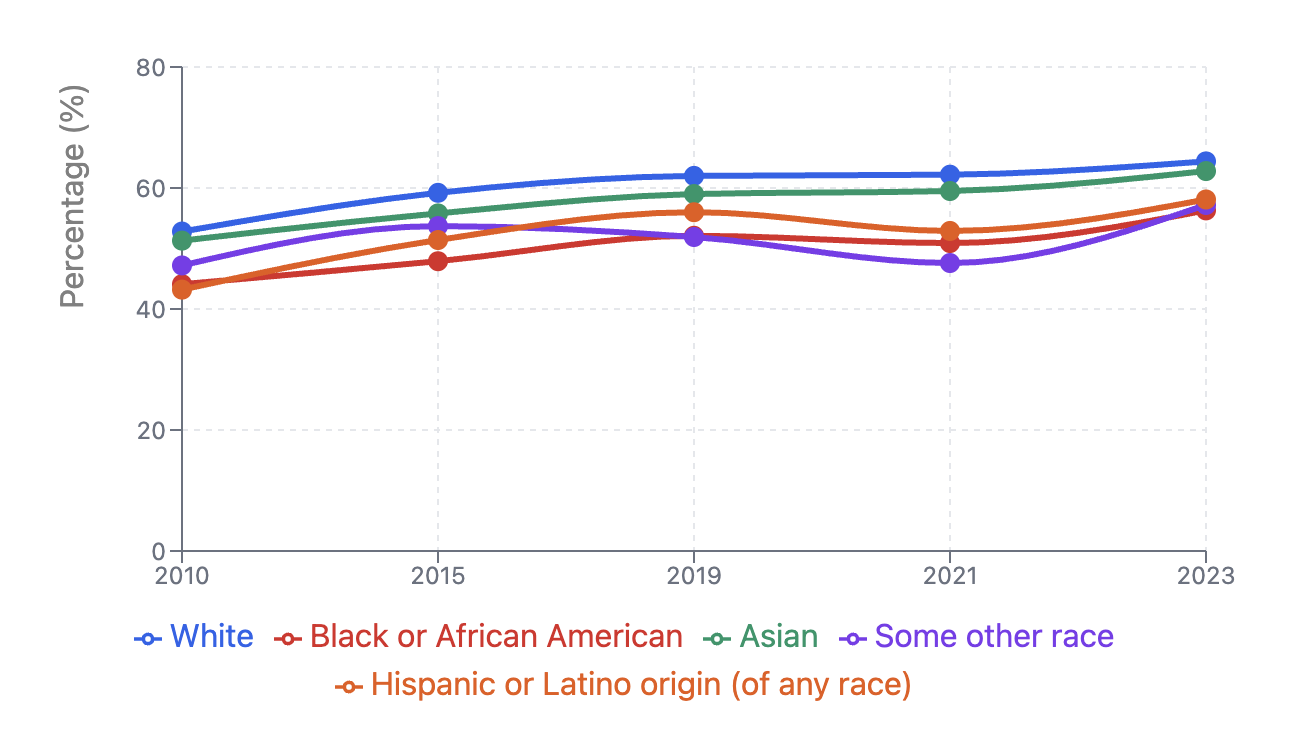
Employment rates rose substantially across all racial and ethnic groups in Philadelphia. From 2010 to 2023, Hispanic/Latino employment experienced the highest growth, rising from 43.2% to 58.1%---a 34.5% growth. Black/African American employment rose from 44.1% to 56.3%, leading to a 27.7% increase. Asian employment improved from 51.3% to 62.8% with a 22.4% increase and White employment increased from 52.8% to 64.4% with a 22.0% improvement.
Our assessment of employment disparities—the gaps in employment rates between racial and ethnic groups—shows some transformation over time. The gap between White and Black employment narrowed from 8.7 percentage points in 2010 to 8.1 percentage points in 2023, while the Hispanic-White gap decreased from 9.6 to 6.3 percentage points.
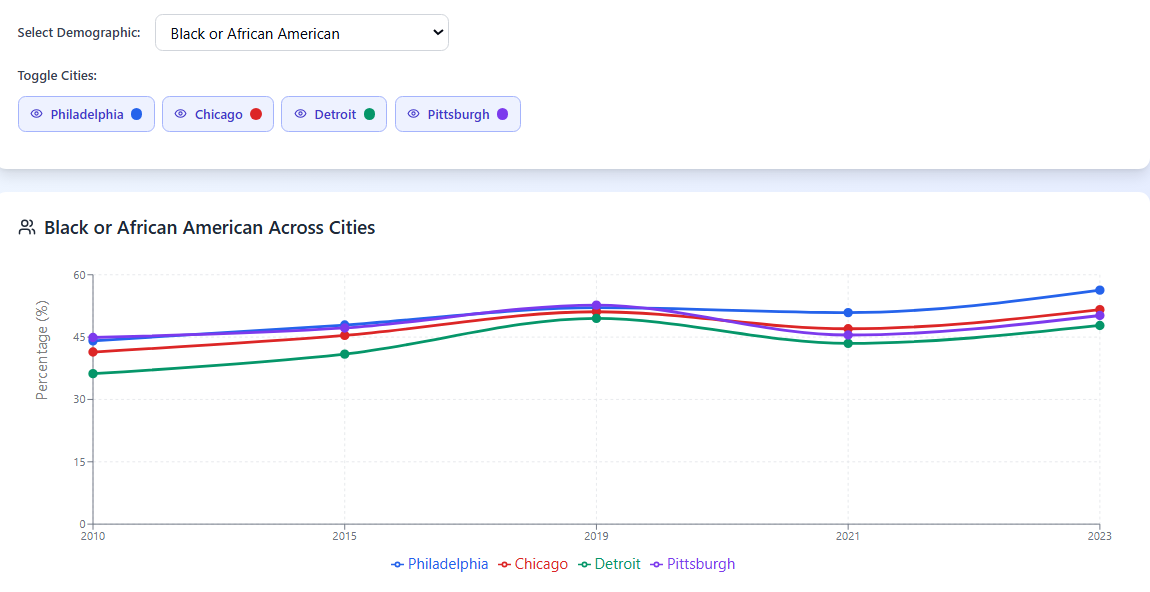
Philadelphia's racial employment outcomes show both strengths and gaps when compared to peer cities. Looking at the employment rate specifically for 2023, Philadelphia demonstrates clear strength in Black employment, with its 56.3% rate exceeding Chicago (51.6%), Detroit (47.8%), and Pittsburgh (50.2%).
However, when it comes to Hispanic employment, Philadelphia's performance has been more mixed in 2023—while its 58.1% rate significantly outpaces Detroit (54.9%), it trails Chicago's 64.4%, suggesting that Chicago has been more successful in integrating Hispanic workers into its labor market.
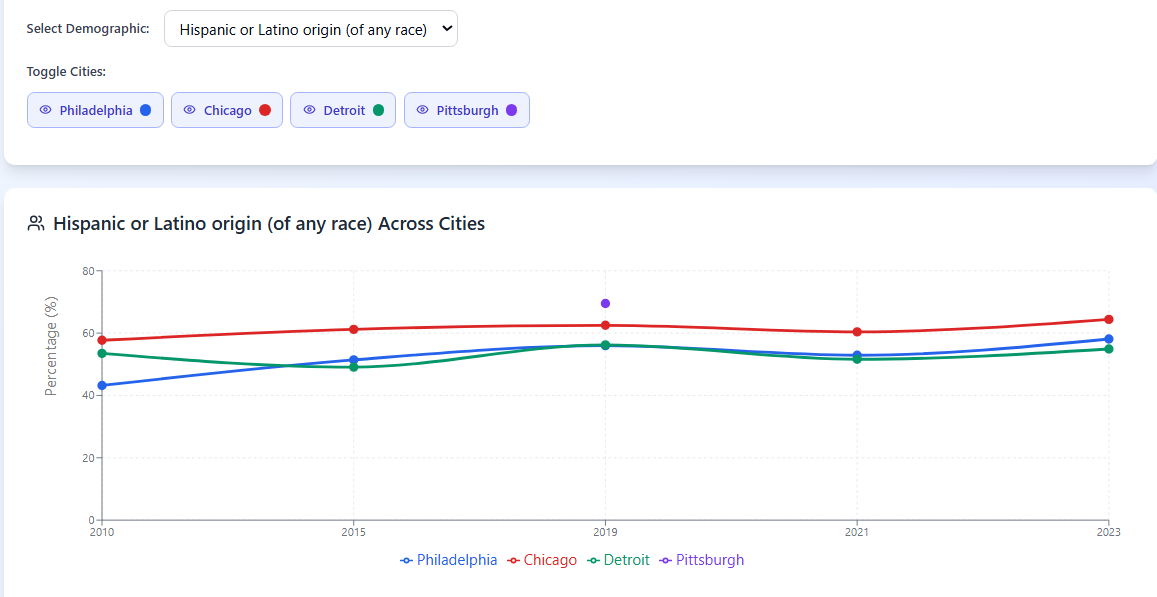
At the same time, when the growth rate is considered, Philadelphia outperforms in Hispanic/Latino employment with a dramatic growth of 34.5% from 2010 to 2023 (from 43.2% to 58.1%), representing the fastest pace of improvement among peer cities. Chicago, despite leading in Hispanic employment rate, achieved more modest growth of 11.6% over the same period (from 57.7% to 64.4%), while Detroit showed minimal progress with only 2.6% growth (from 53.5% to 54.9%).
Causes & Implications:
The improvements in employment diversity reflect real-world factors including targeted workforce development programs, expansion of industries with diverse hiring practices, and demographic shifts that have reshaped Philadelphia's labor market. Philadelphia Works for example, the city's Workforce Development Board, has developed comprehensive workforce strategies responding to business needs while increasing economic opportunity for all residents. Through programs like the Good Jobs Challenge, the organization aims to train and connect more than 3,000 individuals from underserved communities in Southeastern Pennsylvania to quality employment opportunities. Philadelphia Works seeks to reduce labor market barriers and expand access to good jobs with particular focus on growth sectors including healthcare, life sciences, infrastructure, and energy.
- The particularly strong gains among Hispanic/Latino workers likely correlate with growth in construction, logistics, healthcare support, and food service sectors—industries that have historically provided employment pathways for immigrant communities and workers with varying English proficiency levels. U.S. Bureau of Labor Statistics data confirms that, as of 2024, construction reported the highest proportion of Hispanic/Latino workers among all U.S. industries, at 35.1%, followed by the leisure and hospitality sector at 26.6%. A BLS Career Outlook Report shows that construction employed roughly 3.4 million Hispanic/Latino workers nationally in 2018 (about 13% of all Hispanic/Latino workers), with the industry experiencing 11% projected growth from 2018-2028—more than double the 5% average for all industries. A previous ELGP report found that the healthcare sector added the most jobs among the target industries over the past decade, averaging 3,000 new positions annually—many in middle-skill occupations. Retail and hospitality ranked second, adding 1,400 jobs per year, with 83% classified as low-skill roles.
- This rapid expansion of the healthcare sector may have also been a key reason behind the substantial improvement in Black employment rates in the past decade. The healthcare and relevant social services have reported a steady increase in representation of African American workers. Research from National Public Pension Coalition has shown that public sector jobs have historically been instrumental in providing African Americans with pathways to economic stability and upward mobility, offering equitable opportunities often unavailable in the private sector, with stronger anti-discrimination protections than in private employment. According to the journal Health Affairs, Black women are more represented in the healthcare sector than any other demographic group, with 23% of those in the labor force employed in healthcare. Within this group, they are most likely to work in long-term care settings (37%) and in roles as licensed practical nurses or aides (42%).
However, the persistent employment gaps, while narrowing (such as the 8.1 percentage points Black-White gap in 2023), suggest persistent continued structural barriers.
- Research from the Federal Reserve Bank of Philadelphia on spatial mismatch confirms that residential segregation isolates urban Black residents from work opportunities, with commuting costs serving as obstacles for inner-city people to attend job interviews and arrive to work on time, while public transportation may not be prompt or stop at all job locations.
- A Pew study reveals that Black workers are the most likely to experience employment and workplace discrimination, with about four-in-ten Black workers (41%) reporting they have experienced discrimination or unfair treatment by an employer in hiring, pay or promotions because of their race or ethnicity, compared to much smaller shares of Asian (25%), Hispanic (20%) and White (8%) workers.
- Data from the National Conference of State Legislatures shows that, in Pennsylvania, about one in three adults has a criminal record, with these individuals disproportionately Black and Hispanic. A report released by the Philadelphia District Attorney’s Office confirms that although Black Philadelphians represented approximately 38% of the city’s population between 2015 and 2022, they accounted for 69% of all arrests during that period—a significant disparity in arrest rates. According to the United Way of Greater Philadelphia and Southern New Jersey, more than 90% of employers conduct criminal background checks, and individuals with criminal records are only half as likely to be offered a second interview or a job compared to applicants without a record. Despite Philadelphia's Fair Chance Hiring ordinance prohibiting criminal record inquiries during initial applications and interviews, the persistence of employment gaps suggests these protections may not fully address underlying barriers to employment access.
- Additionally, research from the Federal Reserve Bank of Philadelphia between 2017 and 2021 shows that Black and Hispanic workers were much more likely than white workers to work in lower-wage, segregated occupations. White men's overrepresented occupations had annual wages roughly $20,000 to $30,000 higher than occupations where other racial groups were overrepresented.
The fact that gaps narrowed modestly during 2010-2023 rather than dramatically suggests that while overall economic expansion lifted all groups, it did not fundamentally alter underlying employment access inequities.
Conclusion
Philadelphia's employment data from 2010 to 2023 shows increases across all race/ethnic groups examined in this analysis, with Hispanic/Latino employment growing by 34.5%, and Black employment rates exceeding those in peer cities by 2023. However, employment disparities between racial and ethnic groups persist, with the Black-White employment gap narrowing only modestly from 8.7 to 8.1 percentage points over the 13-year period. These employment rate improvements raise important questions about job quality and economic mobility: are workers from historically underrepresented groups gaining access to positions with living wages, benefits, and career advancement opportunities, or are they concentrated in sectors with limited economic security and upward mobility potential? The employment gains among Hispanic/Latino workers in construction and hospitality, and among Black workers in healthcare support roles, may reflect sectoral concentration rather than broad-based access to high-quality employment across industries. The data suggests that while economic expansion during this period benefited multiple demographic groups, underlying structural factors and race-based complexities affecting both employment access and job quality remain.
Citations


