8. Macro Indicators: Who’s Working in Philadelphia? A Look at Employment Gains by Age and Education Since 2010
Authored by: Ziqi Zhou
Date: June 5th, 2025
Philadelphia's employment landscape has undergone a remarkable transformation over the past decade, adding 379,200 jobs between 2013 and 2023, a 14.07% increase. Growth was led by Education and Health Services (+156,300 jobs, +28.5%) and Professional and Business Services (+87,900 jobs, +21.4%), while Trade, Transportation, and Utilities added 50,100 jobs (+10.1%), even as Manufacturing declined by 6,000 jobs (-3.2%). This shift reflects Philadelphia's long evolution from an industrial economy and towards a knowledge-based and service economy.
Understanding these employment shifts is critical for evaluating how Philadelphia’s economic transformation has influenced workforce participation and opportunities across demographic groups, thereby informing future strategies to promote inclusive and equitable growth. In this Leading Indicators series on employment, we explore how and why Philadelphia’s workforce has evolved over time, with a focus on demographics. This edition specifically focuses on shifts in employment patterns across different demographic groups (age, and education) from 2010 to 2023.
By benchmarking against peer cities like Chicago, Detroit, and Pittsburgh, we attempt to identify successful approaches that have driven Philadelphia's 14.07% overall employment increase and pinpoint where continued interventions are needed to ensure all residents can participate in the city's economic advances.
What You Need to Know
Philadelphia’s employment rate for people aged 16 and over rose from 48.7% in 2010 to 60.2% in 2023. That’s an increase of 11.5 percentage points—meaning 11.5 more out of every 100 people were working. In relative terms, that’s a 14.07% increase from where we started. Put simply: the 11.5 figure shows how much the rate went up, while the 14.07% shows how big that increase is compared to the starting point.
All demographic groups showed meaningful improvement, confirming truly inclusive economic growth. Specific insights in this LI include:
- Age Groups: Philadelphia's youth employment (16-19 years) led demographic improvements with a 72.5% increase, reaching 29.5% in 2023, which now exceeds Chicago (25.9%) and Detroit (25.9%) while closely matching Pittsburgh (29.3%).
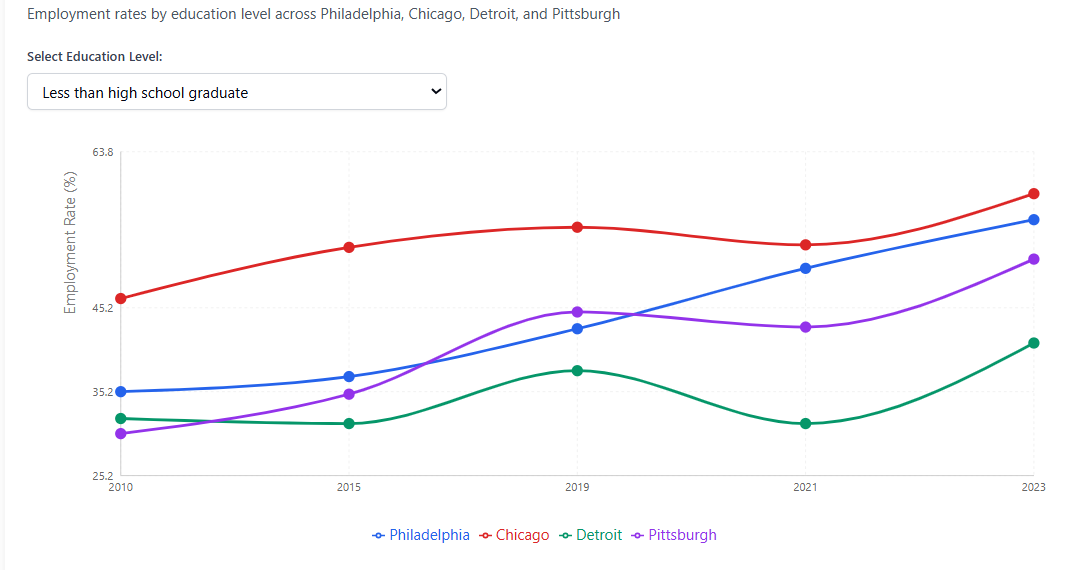
- Educational Attainment: Workers with less than high school education experienced the most dramatic transformation with a 58.2% increase to 55.7%, trailing Chicago (58.8%) but leading Detroit (41%) and Pittsburgh (51%), while college graduate employment (89.2%) leads Chicago (88.8%), Detroit (77%), and Pittsburgh (87.3%).
Age-based Employment Analysis
Philadelphia leads peer cities in the employment-to-population ratio for the youngest age group (up to 19 years of age), reaching 29.5% in 2023. However, with increasing age brackets, the proportion of employed population is relatively lower for Philadelphia compared to peer cities.
Overall Trends From 2010 to 2023, all demographic groups in Philadelphia have shown meaningful improvement. As of 2023, the city’s youth aged 16-19
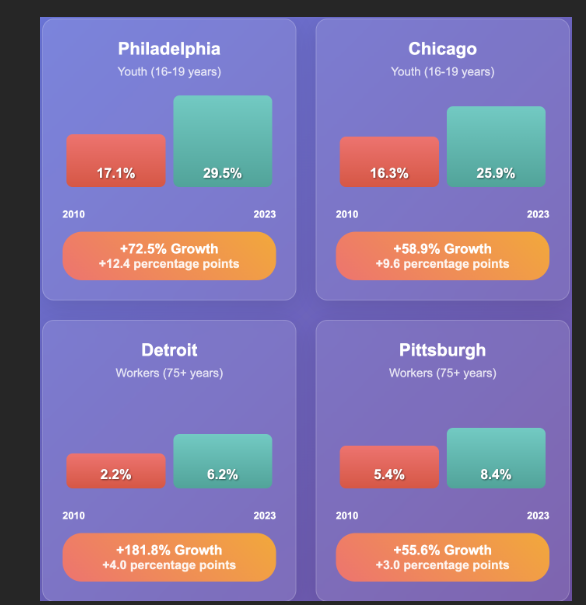
recorded the highest relative growth, climbing from 17.1% in 2010 to 29.5%. This 12.4 percentage point increase represents a 72.5% improvement, suggesting successful youth engagement initiatives and entry-level job creations. The second-highest growth was found in older workers aged 65-74, with employment rising from 21.6% to 29.1%. This 7.5 percentage point increase — growth of 34.7% — indicates improved opportunities for older workers seeking continued employment. The third-highest growth was seen in the 55-59 age group, increasing from 58.7% to 74.5% — a 15.8 percentage point gain and 26.9% increase. Meanwhile, prime-age workers (25-54 years) demonstrated steady growth across multiple cohorts. The 45-54 age group saw employment rise from 59.1% to 68.2%, growth of 15.4%. The 35-44 age group followed with a 13.5% increase, as employment rose from 72.5% to 82.3%. The 30–34 age group experienced an 8.1% increase, from 74.9% to 81%. Finally, the 25–29 age group showed the smallest relative gain among prime-age workers, rising from 76.3% to 78.9%, growth of just 3.4%.
Chicago saw a similar pattern, with its strongest gains found among youth (16-19 years) — a 58.9% increase from 16.3% to 25.9% in 2023. However, Detroit and Pittsburgh saw their biggest employment growth in older worker engagement. Detroit's most dramatic transformation occurred among workers 75 years and over; employment rates for the city’s oldest workers nearly tripled, from 2.2% to 6.2%. Pittsburgh also demonstrated its greatest progress among workers in the oldest age brackets, with 75+ year-olds experiencing a 55.6% employment increase from 5.4% to 8.4%.
Causes & Implications
What explains the substantial increase in employment among 16-19 year olds in Philadelphia? Does the increase also represent cause for concern?
- Most youth in this age range have completed only high school, indicating that a growing number of young people are choosing immediate employment over continued education. This concern aligns with national trends from the U.S. Bureau of Labor Statistics showing college enrollment rates for recent high school graduates declining from a peak of 70.1% in 2009 to 61.4% by 2023, with overall college enrollment dropping 15% between 2010-2021. This shift could be a reflection of a rational choice, with rising education costs no longer justifying the wage premiums traditionally associated with higher education, suggesting that the economic return on educational investment has diminished for many families.
- The trend may also signal inadequate state and city support for higher education accessibility, including insufficient financial aid, scholarship programs, or affordable community college pathways that would enable youth to pursue post-secondary education while managing economic pressures. If educational support systems are falling short in making college accessible and financially viable, young people may rationally choose immediate employment over debt-laden educational pursuits.
- More troubling, this pattern could signal a growing talent retention challenge, where Philadelphia's most capable youth enter the workforce immediately rather than pursuing higher education that might subsequently draw them to other metropolitan areas with stronger knowledge-economy opportunities. This could create a feedback loop where the city retains workers in lower-skill positions while losing potential future leaders and innovators to other regions.
- The youth employment surge might also reflect broader economic structural changes where traditional middle-skill jobs—historically requiring some post-secondary education—are either disappearing due to automation or being deskilled to require only high school completion. While increased youth employment appears positive on the surface, it may represent a concerning erosion of economic mobility pathways if these jobs lack advancement opportunities or career development potential.
Turning to the increase at the other end of the labor market, the increase in employment among older workers may be indicators of less sanguine issues:
- Rising employment rates among workers aged 55 and above could stem from inadequate retirement savings. Many Americans face retirement security crises exacerbated by the decline of traditional pension systems and volatile 401(k) performance over the past decade. Bureau of Labor Statistics data shows that access to defined benefit pensions among private industry workers dropped from 20% in 2010 to 15% in 2023, while defined contribution plan access grew from 59% to 67%. Additionally, Federal Reserve research shows that only 52% of retirees without private income sources (i.e. those relying solely on Social Security) report doing "at least okay financially," compared to 85% of retirees with labor income. Social Security benefits alone prove insufficient income for many retirees to maintain their standard of living, compelling continued workforce engagement well past traditional retirement ages.
- This pattern raises questions about economic equity and intergenerational competition for jobs. Older workers remaining in the workforce longer may limit advancement opportunities for younger employees, particularly in sectors where institutional knowledge and experience provide competitive advantages. Additionally, older workers' continued employment out of financial necessity rather than choice suggests broader systemic failures in retirement planning infrastructure and social safety nets.
Educational Attainment and Employment
Philadelphia ranks among the top performers for employment of workers with less than high school education, reaching 55.7% in 2023—trailing only Chicago (58.8%) while significantly outperforming Detroit (41%) and Pittsburgh (51%). While employment rates generally increase with higher levels of educational attainment, Philadelphia’s most striking progress was among those with less than a high school education.
Overall Trends
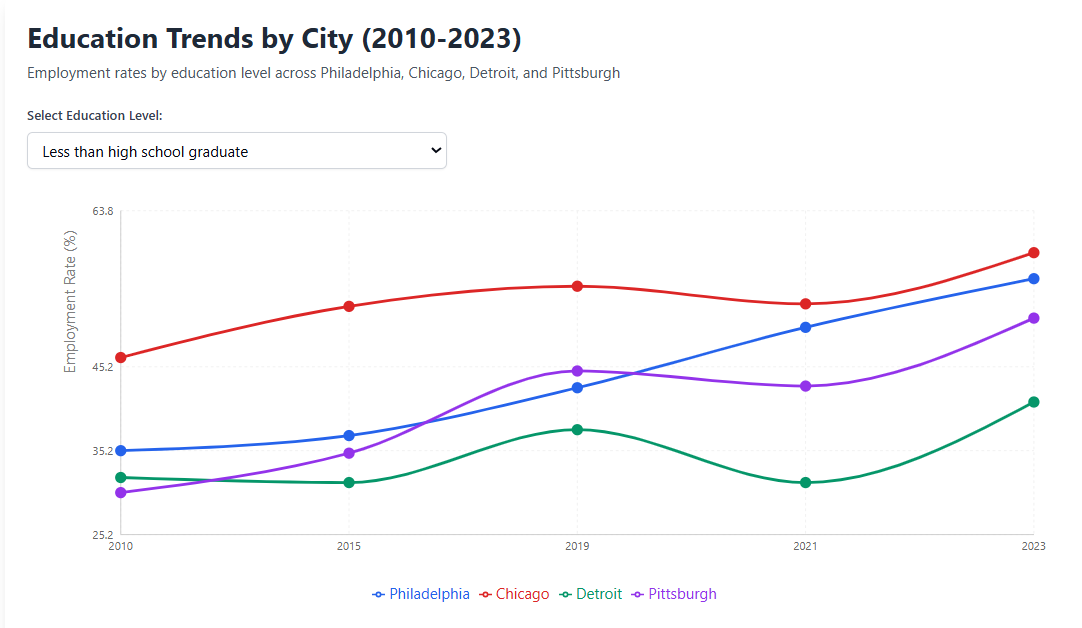
From 2010 to 2023, Philadelphia experienced steady employment gains across all education levels, with the strongest relative growth occurring among those with lower formal education. Workers with less than high school education had the most dramatic improvement, rising from 35.2% to 55.7%—a 20.5 percentage point gain, representing a remarkable 58.2% increase. The second highest improvement was found among high school graduates, increasing from 56.0% to 62.8%—a 12.1% growth and 6.8 percentage point gain. Workers with some college or an associates degree followed closely in third place, rising from 66.4% to 74.0%, equivalent to a 11.4% growth. Although college graduates already had high employment levels, their rate increased from 82.2% to 89.2%, representing the smallest relative growth at 8.5%.
Chicago mirrored Philadelphia's trends almost exactly, with high school graduates growing 12.2%, some college workers increasing 10.6%, and college graduates rising 5.7%—demonstrating a similar inverse relationship between educational attainment and employment growth rates. However, Detroit showed the most extreme convergence pattern, with high school graduates experiencing explosive 42.8% growth while college graduates saw minimal 6.5% increases, suggesting more dramatic labor market restructuring. Pittsburgh bucked the convergence trend entirely, showing modest and inconsistent gains across education levels (high school: +5.0%, some college: +11.2%, college graduates: +3.6%), indicating a more stagnant overall employment environment regardless of educational credentials.
Causes & Implications
The striking improvement in employment among individuals with less than high school education warrants closer examination, with key potential drivers and concerns including:
It could suggest significant structural changes in Philadelphia's economy, potentially driven by labor shortages that could have forced employers to reduce credential requirements and invest in on-the-job training programs. This "skills-based hiring" trend, as identified by Harvard Business School research and adopted by major employers like Dell, Accenture, IBM, and Amazon, was accelerated by post-pandemic workforce shortages and had opened opportunities previously reserved for more credentialed workers (As of 2024).
| Indicator | Statistics |
|---|---|
| Average student debt (2023) | $29,300 per graduate |
| Graduate salary trend | -2.58% decline (inflation-adjusted, 2007-2022) |
| Recent graduate underemployment | 40% in jobs not requiring their degree |
| All graduate underemployment | 33% in occupations not needing degrees |
- This convergence paradoxically validates the rational decision-making of youth choosing immediate employment over continued education: if workers without high school completion can achieve 55.7% employment rates while college graduates reach 89.2%, the educational premium—while still substantial—may not justify the time and financial costs of higher education for many families. The narrowing gap between high school graduates (62.8%) and those with some college (74.0%) particularly suggests diminishing returns on initial post-secondary investments.
- This concern is also supported by mounting evidence of declining educational returns. For instance - the Federal Reserve Bank of San Francisco reports that the college wage premium has "flattened out over the past ten years" and declined notably since the pandemic, particularly for racial and ethnic minorities. Meanwhile, students graduated with an average of $29,300 in debt in 2023, according to the College Board’s report on “Trends in College Pricing and Student Aid 2024“. A recent report from the Education Data Initiative revealed that inflation-adjusted starting salaries for college graduates declined 2.58% from 2007 to 2022. Similarly, research from Penn's Wharton Budget Model indicates that "diminishing returns appear to be setting in as the U.S. population seeks more college education," with studies finding that increases in college enrollment have led to declines in the average quality of graduates. Additionally, over 40% of recent college graduates are "underemployed" in jobs that don't require their degree, according to Federal Reserve Bank of New York data, while 33% of all college graduates work in occupations where their degree is not needed.
Taken together, these factors may create a self-reinforcing cycle where reduced educational attainment becomes economically rational in the short term but limits the city's capacity to attract high-value industries requiring skilled workforces. For example, Philadelphia's Technology Services sector, despite having the highest average wage ($126,000) among target sectors and growing rapidly since 2006, remains the city's smallest target sector with only 15,000 jobs (2.3% of total employment). Meanwhile, according to the report from Korn Ferry, nationally the technology industry faces a projected shortage of 4.3 million skilled workers by 2030 that could cost $449.7 billion in unrealized revenue.
Additionally, this pattern also raises critical questions about wage quality and career advancement potential. Are the newly employed workers without high school completion earning living wages with benefits and advancement opportunities, or are they concentrated in precarious, low-wage positions? The convergence in employment rates may mask persistent wage gaps that still make higher education economically advantageous over career lifespans, even if initial employment access has improved.
Conclusion
Philadelphia’s employment landscape has evolved meaningfully over the past decade, with the strongest gains among groups historically underrepresented in the labor market—particularly older adults and those without a high school diploma. While these trends reflect positive movement toward a more inclusive workforce, persistent gaps remain between education levels and across age cohorts. As the city prepares for future economic shifts, continued investment in upskilling, adult education, and inclusive hiring practices will be critical to sustaining these gains and ensuring that all Philadelphians can participate in the region’s economic growth.


