5. Micro Indicators: Philadelphia’s Credit Card Ownership — A Double-Edged Sword for Inclusion
Published: May 1st 2025
Written by: Saloni Tandon, Siqi Dai
In this Leading Indicator, we examine credit card ownership as a critical component of household financial inclusion and economic mobility in Philadelphia and peer cities. Credit cards can serve as essential tools for building credit and managing expenses, but they also carry risks of debt accumulation and financial instability, particularly for vulnerable populations. Philadelphia stands out with consistently high rates of credit card ownership, but deeper analysis reveals persistent disparities by race, income, and education. Understanding these trends is key to designing inclusive financial strategies that maximize benefits and mitigate risks.
What you need to know:
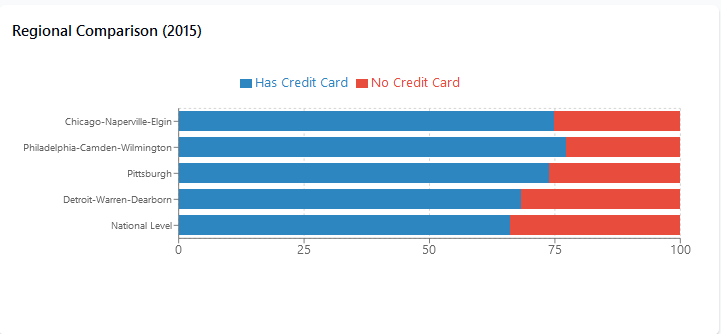
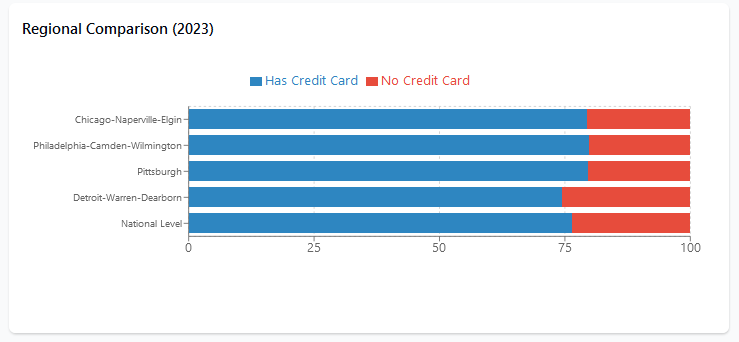
- Philadelphia leads in credit card ownership – The city held the highest rate among peer regions, rising from 77.2% in 2015 to 79.8% in 2023. Chicago and Pittsburgh followed closely at 79.5% and 79.6%, while Detroit lagged behind at 74.4%.
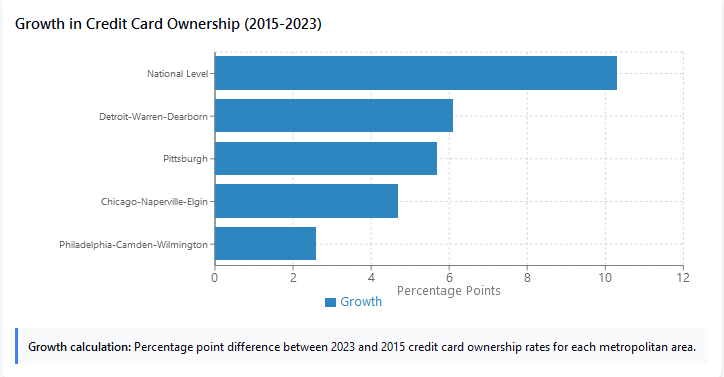
- Steady but moderate growth – Philadelphia’s 2.6 percentage point increase reflects stable participation rather than rapid expansion, likely due to already high baseline levels.
- Persistent racial disparities – While White households report high financial inclusion, available data suggests ongoing gaps for Black, Hispanic, and other minority households.
- Policy action is essential – Expanding culturally relevant financial education, adopting alternative credit assessments, and strengthening consumer protections are key to closing these gaps.
Click here for an overall interactive dashboard showing all the data available!
Unpacking Credit Card Ownership Trends Across Philadelphia and Peer Cities
Access to credit is a cornerstone of financial inclusion and economic opportunity. For many households in America, the ability to borrow—even in small amounts—can be the difference between financial stability and financial hardship. Credit allows individuals to smooth consumption, manage unexpected expenses, and invest in their futures, whether through education, homeownership, or entrepreneurship.
Among the various forms of credit available, credit cards represent the most common and accessible entry point. As the default credit product for millions of Americans, credit cards serve not only as a convenient payment tool but also as a gateway to building a credit history. This makes them a critical measure of financial access and inclusion. Given their prevalence and potential to support—or undermine—financial health, examining patterns of credit card ownership offers valuable insight into the state of economic resilience and equity across households and communities.
National Trends in Credit Card Ownership (2015–2023)
Nationally, credit card ownership has expanded significantly over the past decade. Between 2015 and 2023, the share of households with credit cards rose from 66.1% to 76.4%, according to FDIC National Survey data. This increase reflects broader economic recovery following the Great Recession, growth in digital financial services, and the expansion of financial education initiatives. Notably, the COVID-19 pandemic accelerated credit card adoption, driven by the necessity of e-commerce and contactless payments, along with expanded government financial assistance programs.
Click here for the interactive version of the graph
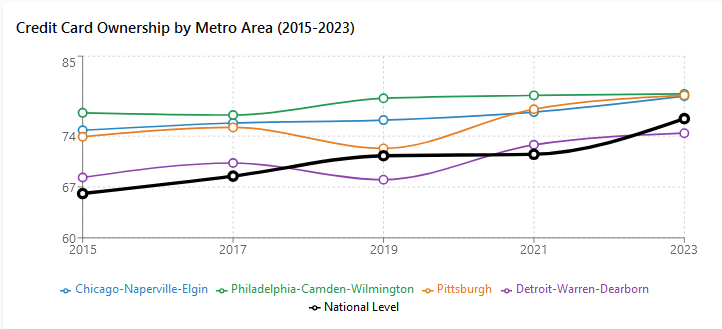
Philadelphia vs. Peer Cities: Credit Card Ownership (2015–2023)
The Philadelphia-Camden-Wilmington MSA demonstrates consistently higher credit card ownership rates compared to national averages and most peer cities. Key findings include:
- Sustained Leadership: Philadelphia maintained the highest credit card ownership rate among studied metros throughout the 2015-2023 period, reaching 79.8% by 2023—3.4 percentage points above the national average.
- Stability Through Economic Challenges: While other regions experienced more volatility, Philadelphia's credit card ownership rates remained remarkably stable, showing only minimal fluctuation during economic disruptions.
- Modest But Consistent Growth: Philadelphia increased from 77.2% in 2015 to 79.8% in 2023, representing a 2.6 percentage point improvement—more modest than some peer cities but building upon an already strong foundation.
This trend could be attributed to several distinctive regional advantages: Philadelphia's historic role as a banking center has created dense, neighborhood-level access to financial institutions; the region's strong higher education presence fosters financial literacy; and the city's diverse economic base—spanning healthcare, education, manufacturing, and services—provides income stability for many households. Additionally, targeted financial inclusion programs operated by the city government and local nonprofits have helped maintain high financial services participation even during economic downturns.
The stability of Philadelphia's credit card ownership rates during periods of national economic volatility further suggests a deeply rooted financial infrastructure that's less susceptible to economic disruption than peer cities.
Philadelphia's credit card ownership trends are best understood when compared to similar metropolitan areas. Each region shows distinctive patterns that reflect their economic conditions and financial inclusion efforts:
Pittsburgh's Rapid Advancement: Pittsburgh has dramatically closed the gap with Philadelphia, with credit card ownership surging from 73.9% in 2015 to 79.6% by 2023. This 5.7 percentage point increase represents the second-strongest growth among the compared cities. Pittsburgh's impressive gains likely stem from its economic reinvention as a tech and healthcare hub, bringing higher-wage jobs and attracting younger professionals with stronger banking relationships. By 2023, Pittsburgh had nearly caught up to Philadelphia, trailing by only 0.2 percentage points despite starting significantly behind.
Chicago's Consistent Progress: Chicago followed a steady upward trajectory, with credit card ownership increasing from 74.8% in 2015 to 79.5% in 2023. This 4.7 percentage point improvement reflects Chicago's diverse economy and comprehensive banking infrastructure. Despite occasional economic challenges and significant neighborhood disparities, Chicago maintained consistent year-over-year growth in credit access. By 2023, Chicago had essentially matched Pittsburgh's rate and closed most of its gap with Philadelphia, demonstrating the effectiveness of its financial inclusion initiatives even amid the city's fiscal challenges.
Detroit's Remarkable Rebound: Detroit exhibited the most dramatic improvement among the compared metropolitan areas, with credit card ownership jumping from 68.3% in 2015 to 74.4% by 2023—a substantial 6.1 percentage point increase. This exceptional growth reflects Detroit's ongoing economic recovery following the city's 2013 bankruptcy and subsequent revitalization efforts. Despite this impressive progress, Detroit remains 5.4 percentage points below Philadelphia and 2.0 percentage points below the national average of 76.4%. Detroit's trajectory highlights both the challenges of rebuilding financial inclusion after severe economic disruption and the potential for substantial improvement through targeted revitalization strategies.
While complementary FDIC data on fully banked households shows Philadelphia outperforming Chicago and Detroit in overall banking inclusion, it also reveals persistent racial disparities. In 2015, White households in Philadelphia were significantly more likely to be fully banked (83.9%) compared to Black households (62.5%)—a gap that likely extends to credit card ownership as well.
These disparities suggest that the benefits of credit access remain unevenly distributed, while the risks of credit-related financial distress may be concentrated among already vulnerable populations.
Impact of credit cards as a medium for credit on economic mobility
Credit cards are a double-edged sword when it comes to economic mobility. They can either support financial inclusion or deepen financial insecurity. In specific, credit cards can offer a financial cushion during emergencies, help build credit histories necessary for future loans, and enable participation in a cashless economy. For many, they serve as an entry point to broader financial services. Alternatively, credit cards also come with significant risks. High interest rates—averaging over 20% in 2023—can trap borrowers in debt. Lower-income households often face worse terms and higher fees, which drain resources from already struggling communities. Easy access to credit can also create a false sense of security without addressing deeper financial challenges.
Philadelphia’s high credit card ownership signals both opportunity and risk. To determine whether credit cards are a lifeline or liability, we need more data on debt burdens and delinquencies—especially for the city’s most vulnerable households.
Recommendations for Equitable and Responsible Credit Access
- Expand Financial Education: Implement culturally tailored financial literacy programs that address both the benefits and risks of credit use, helping consumers make informed decisions about credit card usage.
- Adopt Alternative Credit Assessments: Encourage lenders to consider alternative data such as rent and utility payments to expand access to credit for individuals lacking traditional credit histories, thereby reducing disparities in credit access (New Growth Innovation Network, as cited in Vision Philadelphia, n.d.)
- Promote Low-Cost Credit Products: Support Community Development Financial Institutions (CDFIs) in offering credit cards with lower fees and better terms for vulnerable populations, reducing the risk of predatory practices.
- Strengthen Consumer Protections: Enhance local enforcement against predatory lending practices and expand access to credit counseling services to protect consumers from exploitation.
- Monitor Credit Outcomes: Develop neighborhood-level data systems to track credit use and debt burdens, enabling more targeted interventions to address financial distress.
- Encourage Responsible Lending: Partner with financial institutions to ensure transparent terms and promote responsible lending practices, particularly in underserved communities.
By implementing these strategies, Philadelphia can work towards ensuring that credit cards are used in ways that enhance economic resilience and mobility for all residents, rather than exacerbating existing disparities.
Conclusion
Philadelphia’s leadership in credit card ownership offers significant opportunities for expanding financial inclusion and economic resilience. However, ensuring that all households can benefit equitably requires targeted interventions to close persistent gaps by race, income, and education. By expanding financial education, adopting inclusive credit assessments, and enhancing consumer protections, Philadelphia can continue to strengthen its reputation as a leader in equitable financial inclusion while minimizing the risks that can turn credit cards from assets into liabilities.
References
- FDIC National Survey of Unbanked and Underbanked Households (2015–2023)
- City of Philadelphia (2023)
- Financial Scholars (2024)
- Penn Carey Law School
- New Growth Innovation Network (2025)
- City Controller of Philadelphia (2013)


