6. Micro Indicators: From Tellers to Touchscreens — Tracking Banking Channels in Philadelphia
The Digital Banking Revolution: How Philadelphians Access Banking Services (2015–2023)
In this Leading Indicator we examine the shift from in-person to digital banking (2015–2023), spotlight Philadelphia’s unique banking trends, and outline strategies to advance financial inclusion in a rapidly evolving landscape.
What You Need to Know
- Rapid Digital Adoption: Nationally, combined digital banking usage surged from 47% in 2015 to 68% by 2023, driven predominantly by mobile banking, which increased from 9.2% to 48.3%.
- Decline in Traditional Banking: In-person banking (tellers and ATMs) usage dropped significantly from 49% to 29% during the same period, highlighting a fundamental shift toward digital banking.
- Philadelphia’s Unique Profile:
- Digital adoption in Philadelphia (65.2%) lags behind cities like Chicago (72.3%) and the national average (68%), influenced by demographic and infrastructural factors.
- Philadelphia maintains higher reliance on in-person banking methods (30.7%) compared to peer cities and the national average.
- Philadelphia transitioned to digital banking slightly later (late 2018) than other metropolitan areas, indicating a more gradual adaptation.
- Persistent Inequalities: The limited availability of racial data hampers a comprehensive analysis of disparities in short-term credit access across racial groups and cities. However, based on the observed banking gap, it is reasonable to infer a significant disparity—of at least 21.4 percentage points—in credit card access between Black and White populations.
- Critical Recommendations: Include enhancing digital equity initiatives tailored specifically toward financial services, monitoring banking channel usage across demographics proactively to address disparities, and supporting balanced banking channel approaches that preserve essential physical access points, especially in underserved communities.
Why Banking Channels Matter
The channels through which Americans access financial services represent a critical indicator of economic inclusion, technological adaptation, and institutional evolution. Banking channels—whether digital or in-person—determine not only convenience but also shape:
- Financial Access: Different channels create varying barriers to entry, influencing who can effectively participate in the formal banking system
- Service Equity: Channel availability affects whether all demographic groups receive comparable service quality and financial opportunities
- Economic Efficiency: The cost structure of different banking channels impacts fee structures, interest rates, and overall financial system efficiency
- Community Development: Physical branch presence influences local economic development, particularly for small businesses and lower-income neighborhoods
Understanding these channel preferences and their evolution provides crucial insights into both macro-level economic trends and micro-level financial inclusion patterns that directly impact household financial health.
National Trends: The Digital Transformation (2015-2023)
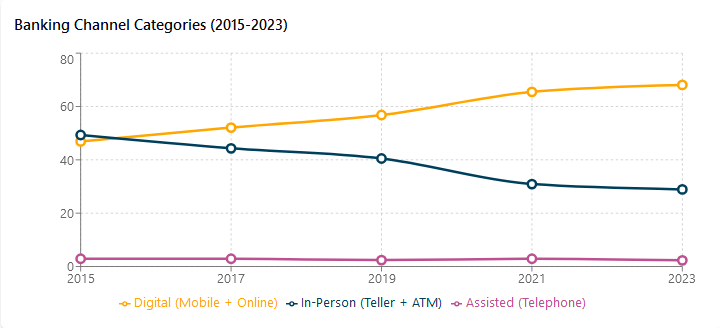
- Digital Banking Surge: Nationally, Digital banking (mobile + online) has soared—from 47% of users in 2015 to 68% by 2023. Mobile banking is the key driver, growing fivefold from 9.2% to 48.3%. Consumers are gravitating toward faster, on-the-go solutions.
- In-Person Banking Decline: In-person banking (tellers + ATMs) fell sharply from 49% to 29% over the same period. Teller usage declined by half, from 28.7% to 15.1%, reflecting branch consolidation and a shift toward digital self-service.
Between 2017 and 2019, most metro areas crossed the tipping point where digital channels overtook in-person banking—marking a decisive shift in consumer behavior.
Philadelphia's Distinctive Banking Channel Landscape
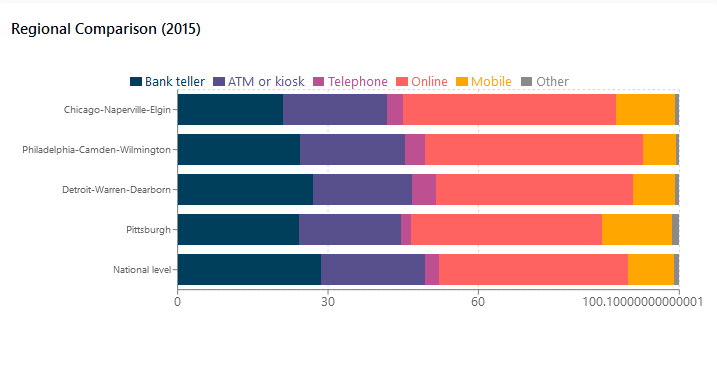
While following the national digital transition, Philadelphia demonstrates unique patterns in banking channel preferences that reflect its specific demographic, institutional, and economic characteristics.
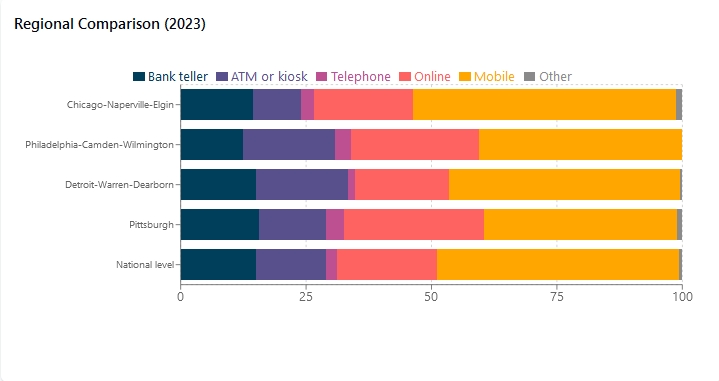
- Digital Adoption Gap: Philadelphia's digital banking adoption rate (65.2% in 2023) lags behind Chicago (72.3%) and the national average (68%), reflecting specific demographic and infrastructure challenges
- In-Person Resilience: Philadelphia maintains stronger in-person banking preferences with 30.7% of households still using bank tellers or ATMs as their primary banking method—higher than Chicago (25.4%), Detroit (27.6%), and the national average (29%)
- Channel Transition Timing: Philadelphia experienced a later digital transition point (late 2018) compared to Chicago (early 2017) and Detroit (mid-2017), suggesting a more gradual adaptation process
- Mobile vs. Online Balance: Philadelphia shows higher continued online banking usage (21.3%) compared to peer cities like Detroit (17.4%), indicating potentially different technological adoption patterns
Driving Factors Behind Philadelphia's Distinctive Patterns
Demographic Foundations
- Age Distribution: Philadelphia's population includes 23% over age 65 (versus 16% nationally), creating persistent demand for in-person services and slower digital adoption (Philadelphia Digital Equity Plan, 2022)
- Income Characteristics: 64.5% of households are low-to-moderate income. About 32% are “subscription vulnerable” to internet costs. In 2019, 27% of households lacked reliable high-speed internet—limiting digital banking uptake.
- Educational Attainment: 28.6% of Philadelphia adults lack post-secondary education, affecting digital literacy and comfort with financial technology adoption
Economic Structure and Transition Challenges
- Industry Composition: Philadelphia's workforce includes 28% employed in healthcare and social assistance—sectors with historically cash-heavy transaction patterns and specific in-person service needs
- Small Business Ecosystem: 89% of Philadelphia businesses have fewer than 10 employees, with many requiring in-person Small Business Administration (SBA) loan consultations and relationship-based banking services
Policy Responses and Market Adaptations
- Building Digital Equity: Expanding affordable internet, adding digital literacy programs, and distributing over 12,000 refurbished devices annually (Philadelphia Digital Equity Plan, 2022).
- Banking Innovations: Institutions offer hybrid service models, develop community-focused products, and redesign branches as advisory centers focused on complex services rather than transactions.
Despite progress, significant challenges remain in creating an equitable banking channel ecosystem:
- Digital Literacy Barriers: 38% of Philadelphia seniors report lacking confidence in mobile banking security features, indicating that access alone doesn't guarantee adoption
- Underwriting Disparities: Automated underwriting algorithms reject 33% of minority-owned microbusiness loan applications that would be approved through relationship lending approaches, creating potential new inequities (DVRPC, 2025)
- Banking Desert Emergence: As branches consolidate, 15 Philadelphia census tracts now qualify as "banking deserts" with no physical financial institution within one mile, disproportionately affecting lower-income neighborhoods
Policy Recommendations for Inclusive Channel Evolution
- Balanced Branch Preservation: Maintain regulatory support for strategic branch preservation in underserved communities while encouraging innovation in service delivery models
- Digital Equity Integration: Expand digital equity initiatives to specifically incorporate financial service accessibility, including targeted mobile banking education for older adults and other digitally vulnerable populations
- Banking Channel Monitoring: Develop more robust monitoring of banking channel access and usage patterns across demographic groups to identify emerging gaps before they become entrenched
- Community Development Support: Leverage Community Reinvestment Act (CRA) requirements to encourage financial institutions to develop technologically innovative approaches to serving lower-income and minority communities
- Small Business Banking Innovation: Create incentives for financial institutions to develop hybrid channel approaches specifically tailored to the needs of small businesses and microbusinesses
Conclusion
The key insight from Philadelphia's experience is that effective banking channel evolution requires recognizing the continuing value of channel diversity rather than pursuing wholesale digital transformation. As financial institutions continue to evolve their service delivery approaches, policymakers, community organizations, and the financial sector must collaborate to ensure that all Philadelphians—regardless of age, income, education, or neighborhood—maintain access to the banking channels that best meet their needs. This balanced approach represents the most promising path toward a financial services landscape that combines technological efficiency with genuine financial inclusion.
Sources
- American Bankers Association. (2024). Consumer banking preferences survey.
- Bankrate. (2024). Digital banking trends in 2024.
- DVRPC. (2025). Community banking decline in Greater Philadelphia.
- FDIC. (2024). National Survey of Unbanked and Underbanked Households.
- Philadelphia Mayor's Office. (2022). Digital equity plan.
- RFI Global. (2024). The big switch: US banking trends.
- The Financial Brand. (2025). WSFS Bank case study.


