1. Micro Indicators: Tracking Income and Inequality in Philadelphia
Philadelphia’s economy has evolved significantly over the past decade, with rising incomes reshaping the city's economic profile. Yet despite this growth, Philadelphia shares stubborn challenges with peer cities like Chicago, Detroit, and Pittsburgh: concentrated poverty in historically disadvantaged neighborhoods, declining homeownership rates, and a persistent opportunity gap that leaves many residents unable to participate in the city's economic advances.
This inaugural Baseline Series examines household income trends across cities and racial groups to determine whether Philadelphia's economic path reflects national patterns or faces unique structural barriers. By benchmarking against comparable cities, we can identify successful approaches elsewhere and pinpoint where Philadelphia needs targeted interventions to create truly equitable prosperity.
What you need to know:
Philadelphia’s income growth is solid but not the strongest – Real median household income grew by 32% since 2010, outperforming Detroit (7%) but trailing Pittsburgh (30%) and Chicago (25%) in percentage terms. At the same time, Philadelphia’s absolute median income ($19,882 in real terms) remains lower than Chicago ($26,367) and Pittsburgh ($21,833) but higher than Detroit ($14,474).
Philadelphia’s racial income disparities are significant but not the worst – The White-to-Black income ratio in Philadelphia has remained high but has not widened as dramatically as in Chicago, where White households now earn 6.4 times more than Black households ($102,958 vs. $16,126). Detroit has the largest racial income gap with Black households seeing just 2.7% real growth since 2010. Pittsburgh, despite its smaller Black population, also exhibits stark economic stratification.
Philadelphia’s income distribution is shifting, but less polarized than Chicago – The high-income population more than doubled (+111.5%), similar to Pittsburgh (+111%) and Detroit (+133%), but still lags Chicago (+87.2%) in absolute numbers. Middle-income households declined across all cities except Detroit, where they grew slightly (+4.5%), indicating that Philadelphia is undergoing an economic restructuring similar to Chicago and Pittsburgh, though less extreme.
Philadelphia’s low-income population shrank significantly but remains sizable – The proportion of low-income households dropped by 40%, similar to Chicago (-40.7%) and Pittsburgh (-39.9%), but Detroit still has the highest concentration of low-income households (35.1% vs. 23.9% in Philadelphia).
Philadelphia’s economy is more resilient than Detroit’s but lags Chicago in absolute terms – Post-2019, Philadelphia’s real income grew by 7.5%, while Detroit saw a 7% decline, highlighting Philadelphia’s stronger economic adaptability. However, Chicago and Pittsburgh maintain higher overall incomes, and Philadelphia’s racial wage gaps, particularly for Black and Hispanic populations, signal a need for more equitable economic policies.
We begin by examining how median household incomes have evolved since 2010. However, rather than looking solely at nominal income—which reflects earnings in current dollars—we also analyze real income, which adjusts for inflation to show actual purchasing power. This distinction is crucial because inflation can erode income gains, meaning that rising wages may not always translate into improved living standards. By assessing both real and nominal incomes across cities, we gain a more accurate picture of Philadelphia’s economic trajectory, how it compares to peer cities, and whether income growth is creating meaningful financial security for residents.
1. Median Household Income
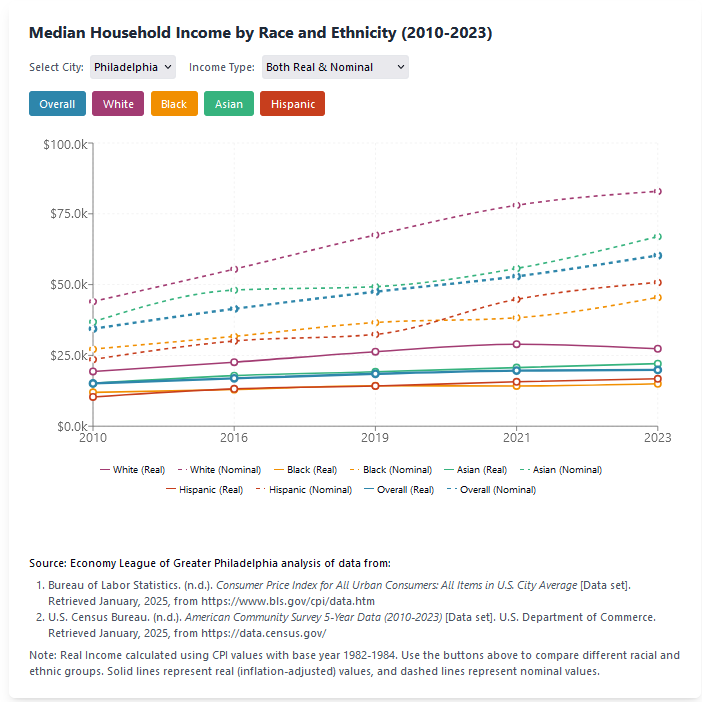
During the period from 2010 through 2023, Philadelphia's real median household income increased from $15,107 to $19,882—a 32% increase in purchasing power—while nominal income values grew by 75%, from $34,400 to $60,302. This stark difference between nominal and real growth highlights the significant impact of inflation on purchasing power during this period.
![Real vs Nominal Incomes across selected cities [2010-2023]](/sites/default/files/inline-images/image_8.png)
Philadelphia's real income growth of 32% positioned it favorably compared to its peer cities. Detroit experienced minimal real growth (7%) and showed concerning volatility, while Pittsburgh achieved comparable growth (30%). Chicago maintained higher absolute real income levels but showed a similar growth pattern (25%).
An important economic insight from this data is the widening gap between nominal and real incomes across all cities. While nominal income figures might suggest substantial economic gains, the inflation-adjusted values reveal more modest improvements in actual purchasing power. For Philadelphia, this means that despite the nominal income appearing to grow by $25,902, the real purchasing power improved by just $4,775 over the 13-year period.
The post-2019 period is particularly notable. Philadelphia's real income grew by 7.5% between 2019 and 2023, demonstrating resilience through the pandemic-related economic disruption. This compares favorably to Detroit, which experienced a 7% decline in real income during the same period, suggesting Philadelphia's economic structure had greater adaptability to these economic shocks.
The relative positions of these cities remained fairly stable in real terms. Chicago maintained its economic advantage with real median household income reaching $26,367 in 2023 (33% higher than Philadelphia). Pittsburgh similarly maintained its position relative to Philadelphia with real income of $21,833.
These patterns reflect the underlying economic structure of each city and their differing recovery paths from industrial decline. The data suggests that while Philadelphia has shown steady improvement in real terms, the perception of economic progress based on nominal figures may overstate the actual improvement in living standards experienced by residents.
2. Income Disparities Across Racial and Ethnic Groups
 Philadelphia's growth story becomes more complex when examining income against racial and ethnic patterns.
From 2010 to 2023, Philadelphia's white households saw real income rise by 41.4%, from $19,333 to $27,346, while their nominal income surged from $44,024 to $82,940 – an 88.4% increase that outpaced both Chicago's 72% increase to $102,958 and Pittsburgh's 72% increase to $75,344.
Asian households in Philadelphia demonstrated strong growth, a 36.5% real income increase from $16,173 to $22,080, with nominal income rising 81.8% from $36,829 to $66,969, though falling short of Detroit's remarkable 108.9% nominal income increase to $59,777. Hispanic households in Philadelphia experienced a notable trajectory, with nominal income climbing from $23,566 to $50,786 – a 115.6% increase that significantly outpaces other demographic groups.
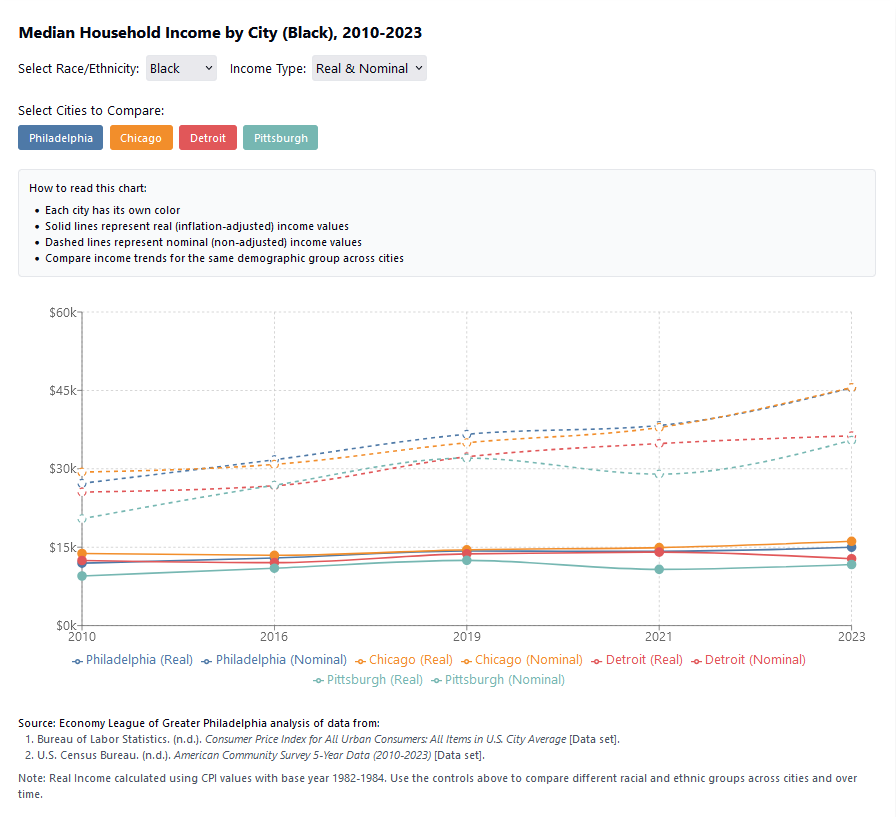
The trajectory for Black households illustrates persistent challenges across all cities. Philadelphia's Black households saw real income rise by just 25.5%, from $11,952 to $14,996, with nominal income increasing from $27,216 to $45,483. This modest growth contrasts with Chicago's even more constrained 16.9% real income increase to $16,126, and Pittsburgh's 23.2% increase to $11,690. Detroit presents the most stark example, with Black household incomes showing a mere 2.7% real income growth. One can see how the income of different races have moved over time using the interactive graphs embedded here.
An alternative approach to analyzing these trends is to examine income disparities across racial groups. The White-to-Other race income ratios in Philadelphia, Chicago, Detroit, and Pittsburgh highlight persistent racial income gaps, with fluctuations over time. A higher ratio indicates that White households earn significantly more than the respective racial group, reflecting a wider income divide.
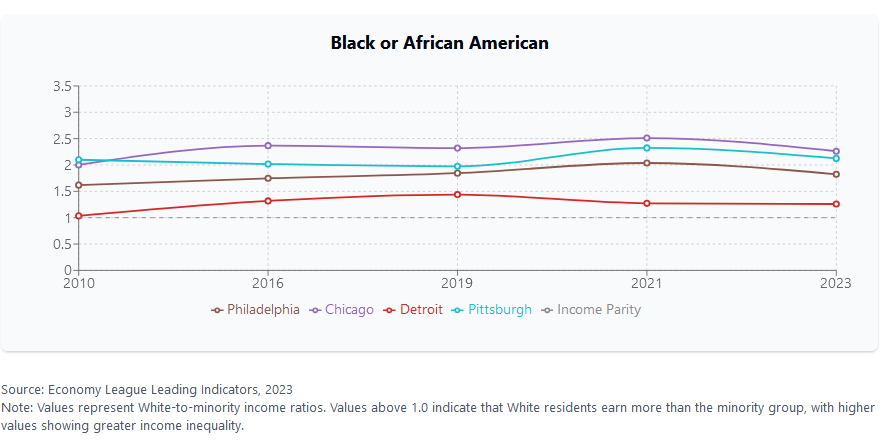
White-to-Black Income Ratio: White individuals consistently earn more than Black individuals. In Philadelphia and Chicago, the ratio peaked in 2021 before slightly declining in 2023, suggesting some narrowing but ongoing gaps. Detroit has the lowest ratio, reflecting broader economic challenges.
White-to-AIAN Income Ratio: The gap for American Indian and Alaska Native (AIAN) populations is volatile, especially in Philadelphia and Pittsburgh, where it spiked in 2016, dipped in 2019, and rose again in 2023, indicating unstable income trends.
White-to-Asian Income Ratio: This ratio is the lowest, meaning Asians face the smallest income gap. However, in Detroit, it widened post-2019, signaling growing disparities.
To understand the full impact of these disparities, consider each city's demographic composition. Philadelphia's population is 38.9% White, 39.3% Black, 7.9% Asian, and 15.7% Hispanic. In contrast, Chicago's population is 32.2% White, 29.2% Black, 7.2% Asian, and 28.8% Hispanic. Pittsburgh shows a markedly different composition with 64.7% White, 22.2% Black, 5.8% Asian, and 3.4% Hispanic, while Detroit's population is 10.6% White, 77.1% Black, 1.6% Asian, and 8.0% Hispanic (U.S. Census Bureau, 2023).
Despite its smaller Black population, Pittsburgh exhibits some of the starkest economic stratification, while Chicago, though having higher absolute incomes across all groups, has seen its racial income gap widen dramatically—White households earning $102,958 compared to just $16,126 for Black households. Philadelphia, however, stands out in a different way: despite having one of the most evenly distributed Black and White populations, it continues to experience significant income disparities. The persistent wage gaps, particularly among its large Black and Hispanic populations, underscore the urgent need for targeted economic development strategies.
3. Income Distribution Across Household Brackets
The household income distributions across Philadelphia, Chicago, Detroit, and Pittsburgh reveal distinctive patterns of economic transformation between 2010 and 2023.
Chicago demonstrates the strongest economic position, with nearly half of all households (49.6%) now in the high-income bracket (≥$75,000), up from 26.5% in 2010. This represents an 87.2% increase in high-income households, resulting in the highest high-to-low income ratio (2.64) among the four cities, more than triple its 2010 ratio of 0.84. Notably, Chicago experienced a 24.4% decline in middle-income households ($25,000-$74,999), suggesting significant upward mobility into higher income brackets rather than stagnation.
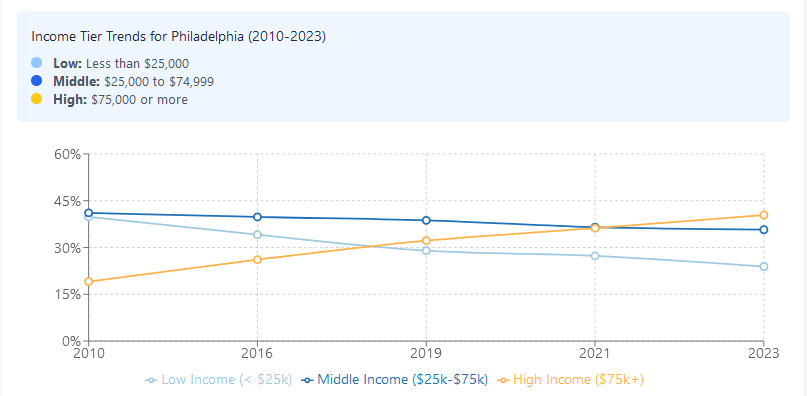
Philadelphia has undergone a dramatic income transformation, with its high-income population more than doubling (111.5% increase) to reach 40.4% of households in 2023, compared to just 19.1% in 2010. The city's median income surged 75.3% from $34,400 to $60,302. However, Philadelphia's economic restructuring shows both gains and challenges: while low-income households (<$25,000) decreased significantly from 39.8% to 23.9% (a 40.0% reduction), middle-income households also declined from 41.1% to 35.7% (a 13.1% drop). The high-to-low income ratio improved substantially from 0.48 to 1.69, reflecting a fundamental shift in the city's economic profile.
Pittsburgh demonstrates the most balanced and robust economic evolution, with median income reaching $66,219 in 2023 (an 83.0% increase from 2010). The city now has 46.2% of households in the high-income bracket (up 111.0% from 21.9% in 2010) and has reduced its low-income population by 39.9% (from 36.1% to 21.7%). Pittsburgh's high-to-low income ratio of 2.13 reflects successful economic diversification beyond its industrial roots. However, like Chicago, Pittsburgh saw a significant decline in middle-income households (-23.6%), indicating a potential "hollowing out" of the middle class as more residents move into higher income brackets.
Detroit, despite improvements, faces ongoing economic challenges. With median income at $38,080 (up 47.7% from 2010), the city shows modest positive restructuring. Detroit is the only city among the four to increase its middle-income population (from 39.8% to 41.6%, a 4.5% increase) and has more than doubled its high-income households (from 10.0% to 23.3%, a 133.0% increase). However, Detroit still maintains the highest proportion of low-income households (35.1%) and the lowest high-to-low income ratio (0.66), though this represents significant improvement from 0.20 in 2010.
Key Trends Across Cities:
- Lower-income reduction is substantial across all cities: Chicago (-40.7%), Philadelphia (-40.0%), Pittsburgh (-39.9%), and Detroit (-30.1%)
- Middle-income contraction in three cities reveals potential economic polarization: Chicago (-24.4%), Pittsburgh (-23.6%), and Philadelphia (-13.1%), while Detroit (+4.5%) shows modest middle-class growth
- High-income expansion is dramatic: Detroit (+133.0%), Philadelphia (+111.5%), Pittsburgh (+111.0%), and Chicago (+87.2%), though Chicago maintains the highest overall percentage (49.6%)
- Economic restructuring patterns differ: Chicago and Pittsburgh show the strongest high-end growth with middle-class contraction, Philadelphia demonstrates balanced growth across all sectors, while Detroit shows improvements from a challenging starting position
- Income polarization has declined significantly: High-to-low income ratios improved dramatically for all cities, with Philadelphia showing the most remarkable change (from 0.48 to 1.69)
This analysis reveals a fundamental economic restructuring across these four cities, with a clear shift toward higher income brackets and reductions in low-income populations. The varying patterns of middle-income change suggest different economic trajectories, with Detroit's middle-income growth potentially indicating a rebuilding phase, while the other cities' middle-income contraction may reflect greater upward mobility into high-income brackets.
In Sum…
Philadelphia's economic trajectory reveals both promising momentum and critical challenges demanding attention. While the city's 32% increase in real median household income demonstrates successful economic diversification, persistent racial disparities and the "barbell" income distribution indicate that growth remains uneven. In the next edition we will see how the most concerning aspect of this development is the sustained high poverty rate among Hispanic residents (above 35%) and Black residents (24.5%), suggesting economic progress has not reached all communities equitably.
Drawing from peer city successes, Philadelphia has the scope to prioritize neighborhood-specific investment programs, expand workforce development initiatives aligned with high-growth sectors, and implement targeted poverty reduction strategies.
Success will ultimately be measured by Philadelphia's ability to translate aggregate growth into meaningful opportunities across all communities. The city's relatively balanced growth patterns compared to peers suggest more equitable outcomes are achievable, but realizing this potential requires sustained commitment to addressing systemic barriers while fostering continued economic development.


