4. Micro Indicators: Who Can Afford to Save? Financial Resilience in Philadelphia
Unpacking level of Financial Resilience across peer cities
In this Leading Indicator, we explore the extent to which households across Philadelphia and peer cities have managed to build emergency savings—a key indicator of financial resilience essential for weathering unexpected economic shocks. Despite impressive growth from 2015 to 2019, Philadelphia’s success remains uneven, marked by significant disparities tied to education, income, race, and age. Understanding these trends is critical, as the city seeks targeted strategies to support more equitable financial stability across all communities.
What you need to know:
- Philadelphia’s emergency savings growth is impressive but uneven – The city's emergency savings rate jumped significantly from 57.7% in 2015 to 71.3% in 2019, far outpacing Chicago (63% to 63.9%) and Detroit (62.3% to 63.6%), and slightly ahead of Pittsburgh (63.4% to 70.8%). However, substantial disparities persist across education, income, race, and age.
- Education disparities remain pronounced – Philadelphia college graduates boast high savings rates (83.1% in 2019), outperforming peers in Chicago (72.6%) and Detroit (70.5%). In contrast, Philadelphia’s high school graduates lag significantly, falling 18.6 percentage points below the city average, reflecting deep, persistent educational gaps.
- Income-based gaps have deepened – High-income Philadelphia households ($75,000+) saw remarkable improvement (84.8% in 2019), surpassing Chicago (79.1%) but trailing slightly behind Detroit (85.5%). Middle- and lower-income groups have not kept pace, widening economic inequalities.
- Racial disparities are likely growing – White Philadelphia households significantly improved their savings rate (77.3% in 2019), outperforming Chicago (71.1%) and Detroit (70.5%). However, limited data on other racial groups prevents a full assessment, suggesting potentially widening racial inequities.
- Older adults improved but remain vulnerable – Seniors (65+) in Philadelphia improved notably (62.8% in 2019) yet remained below the city average by 8.5 points, indicating persistent vulnerability among older populations despite overall progress.
- Economic stability and urban renewal have driven improvements – Economic growth, job market stability, and urban revitalization between 2015-2019 significantly enhanced overall savings rates but may have exacerbated existing inequalities through rising housing costs and displacement pressures.
- Policy actions needed to sustain equity – To address ongoing disparities, Philadelphia should expand comprehensive data collection, invest in culturally-sensitive financial education, develop inclusive matched-savings programs, experiment with micro-savings models, and strengthen partnerships between communities and financial institutions.
Emergency savings refer to funds specifically set aside to cover unexpected financial expenses, such as medical bills, job loss, car repairs, or urgent home repairs. Maintaining an adequate emergency fund is critical for financial stability, providing a crucial safety net that prevents households from resorting to debt or falling into financial hardship during unforeseen circumstances.
Recent national trends reveal persistent challenges in building such financial resilience. As of January 2025, only 41% of Americans could comfortably cover a $1,000 emergency expense using savings, down from 44% in 2024, and a concerning 27% had no emergency savings whatsoever (Bankrate, 2025; LiveNowFox, 2025). Nonetheless, amidst economic pressures such as inflation and elevated interest rates, about 30% of Americans managed to increase their emergency savings in 2024, reflecting positive momentum in personal financial preparedness (CNBC, 2025).
In the Philadelphia-Camden-Wilmington metropolitan area specifically, the current cost of living exacerbates the necessity for robust emergency savings. With average annual household expenditures totaling approximately $86,509, an adequate emergency fund covering three months of expenses would need to be roughly $21,627.25 (U.S. Bureau of Labor Statistics, 2024). This underscores the urgent need for targeted strategies to bolster financial resilience in the region.
This analysis examines available metropolitan statistical area (MSA)-level data for Philadelphia, Chicago, Detroit, and Pittsburgh, alongside national-level data, to evaluate how emergency savings patterns have evolved over the past decade. Unfortunately, due to limited availability of detailed data, this analysis focuses specifically on trends observed from 2015 to 2019, identifying disparities and highlighting areas for policy intervention and strategic community actions. You can view the interactive dashboard showcasing all data here.
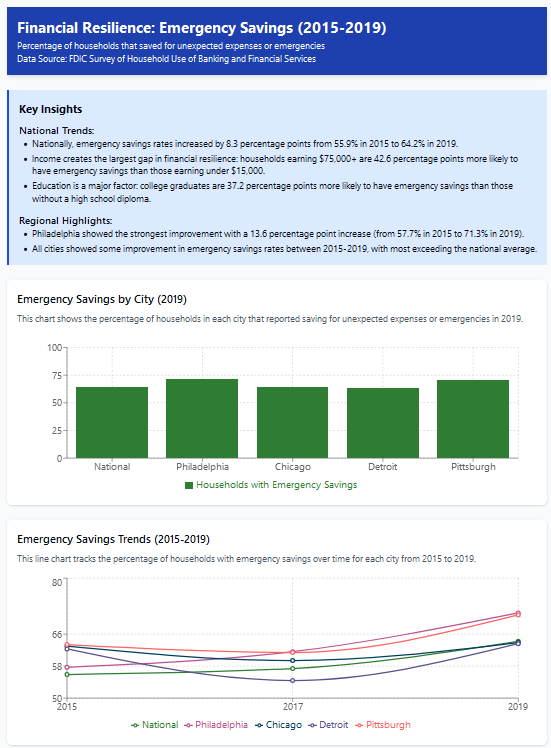
Philadelphia's performance between 2015 and 2019 is especially notable. According to the FDIC Survey of Household Use of Banking and Financial Services, the proportion of Philadelphia-area households with emergency savings rose markedly from 57.7% to 71.3%, a 13.6 percentage-point increase significantly exceeding the national growth of 8.3 percentage points (FDIC, 2019).
Comparative Context: Philadelphia vs. Peer Cities
- Chicago: Emergency savings rates barely moved from 63% in 2015 to 63.9% in 2019, clearly outpaced by Philadelphia’s strong growth.
- Detroit: Experienced minimal net gains (62.3% to 63.6%) accompanied by considerable volatility, contrasting sharply with Philadelphia’s consistent upward trend.
- Pittsburgh: Improved significantly from 63.4% to 70.8%, yet still trailed behind Philadelphia’s impressive performance.
Detailed Insights by Demographic Factors:
Persistent and Widening Education Gaps
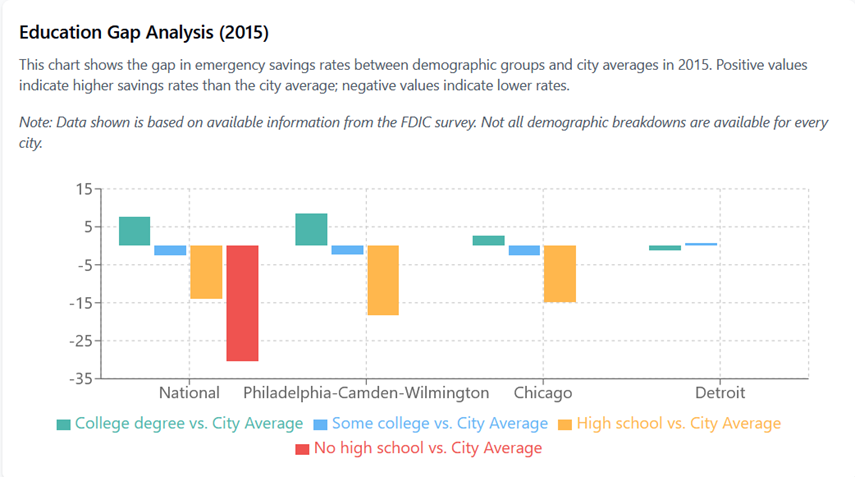
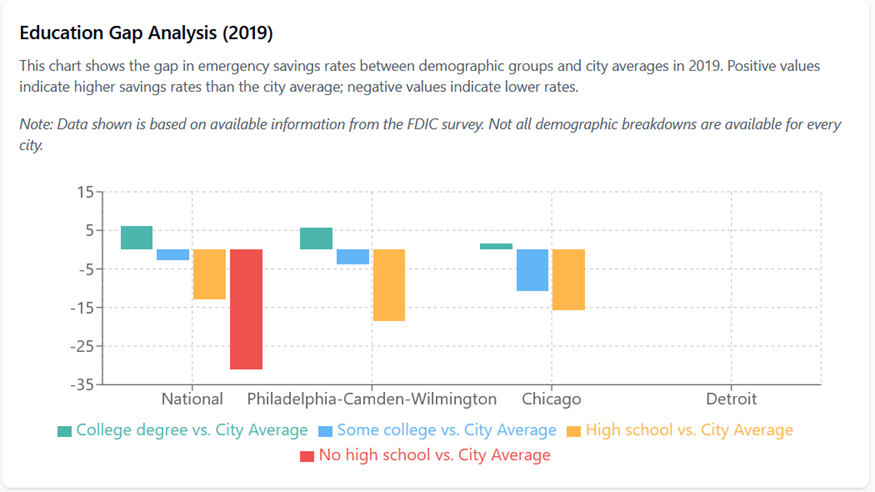
Our analysis reveals that educational attainment remains one of the strongest predictors of emergency savings behavior. The gap between those with college degrees and those without high school diplomas is particularly striking. Nationally, those without high school diplomas were 31.1 percentage points less likely to have emergency savings than the average in 2019, a widening gap compared to 30.4 points in 2015.
- College graduates consistently outperformed city averages across all regions, though the advantage varied from a modest 1.5 points in Chicago to 6.1 points nationally.
- Philadelphia shows one of the largest education-based disparities, with high school graduates 18.6 percentage points less likely to have emergency savings than the city average, compared to 14.6 points below average in 2015.
Philadelphia shows pronounced educational disparities that generally exceed national patterns:
- College graduates in Philadelphia had exceptional savings rates at 83.1% in 2019, placing them 5.8 points above the city average. In 2015, this gap was 8.6 points above average.
- However, high school graduates do not perform well. Philadelphia's high school graduates were 18.6 points below the city average in 2019 (with a savings rate of 58.7%), a worsening from 18.3 points below in 2015 (when their savings rate was 43.1%). This gap between college graduates and high school graduates in Philadelphia slightly narrowed to 24.4 points in 2019 from 26.9 points in 2015 but was still larger than the national gap (19.1 points in 2019).
Philadelphia's college graduates demonstrate remarkable financial resilience especially across the peer cities as well:
- Philadelphia college graduates (83.1% in 2019, up from 70.0% in 2015) outperformed those in Chicago (72.6% in 2019, up from 69.5% in 2015) by 10.5 percentage points in 2019, a dramatic increase from just a 0.5 point advantage in 2015. Philadelphia college graduates also outperformed those in Detroit (70.5% in 2019, up from 68.9% in 2015) by 12.6 percentage points in 2019, a substantial increase from a 1.1 point advantage in 2015.
The education gap in Philadelphia (24.4 points between college and high school in 2019) remains more pronounced than in Chicago (17.1 points in 2019, up from 17.5 points in 2015), highlighting persistent savings gap across education levels.
Income Creates the Deepest Divides
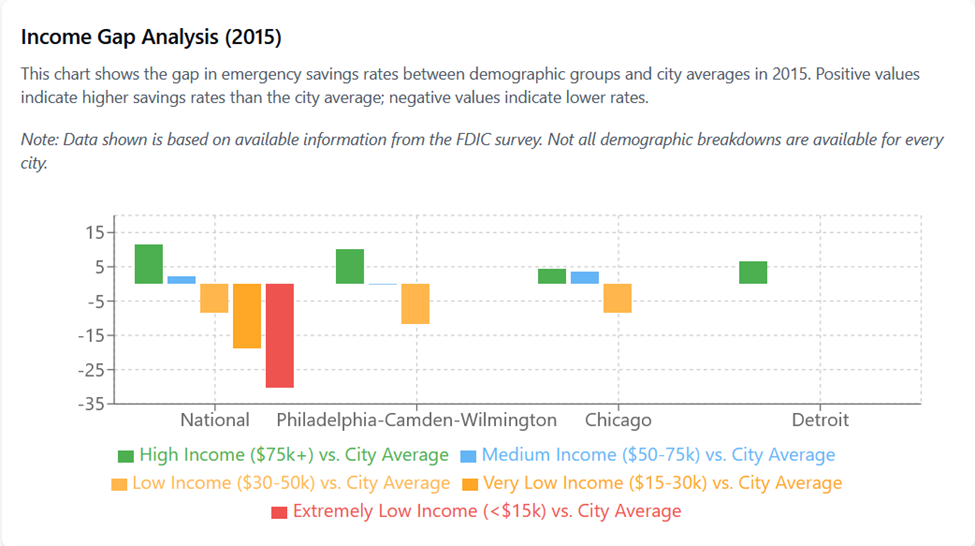
Income-based disparities create the most severe gaps in emergency savings capability. Nationally, the disparities grew more extreme from 2015 to 2019, with the highest and lowest income groups moving further apart.
- Nationally, high-income households ($75,000+) were 9.6 percentage points above average in 2019, a slight decrease from 11.6 points in 2015, while extremely low-income households (under $15,000) were 33.0 points below average in 2019, widening from 30.2 points in 2015.
The wealth gap in savings rates intensified in most cities, with Detroit showing the most striking patterns.
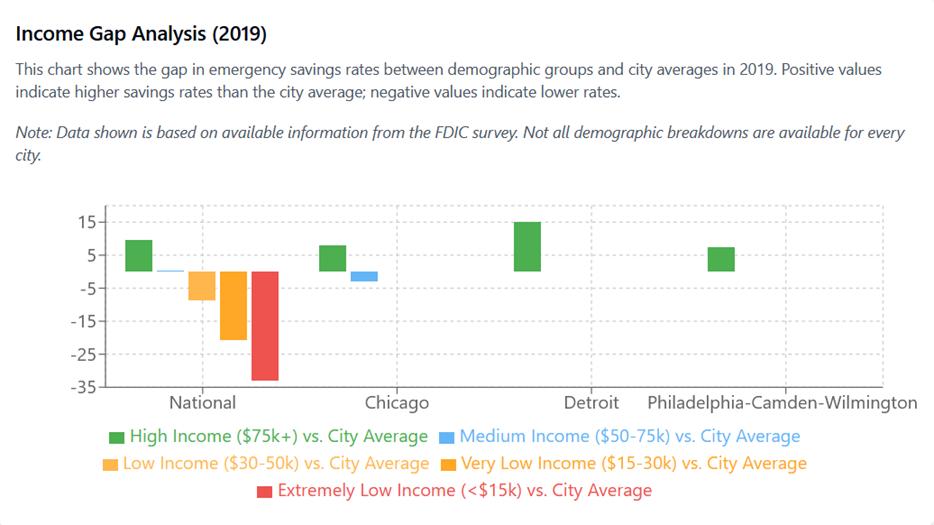
Philadelphia shows distinctive income-based patterns that reveal both strengths and challenges:
- A higher proportion of high-income (More than USD 75,000) Philadelphia households reported saving for emergencies at 84.8% in 2019 (up from 71.6% in 2015), placing them 7.5 points above the city average in 2019 compared to 10.2 points above average in 2015.
- Middle-income ($50,000-$75,000) households in Philadelphia showed a savings rate of 62.8% in 2017, which was 8.9 points below the city average, a marginal increase from 2015 when they were 0.2 points below average with 61.2% of that segment claiming to be saving for emergencies. Unfortunately, data for this segment for 2019 is not available.
- Lower-income ($30,000-$50,000) households in Philadelphia had a savings rate of 49.8% in 2015, placing them 11.6 points below the city average, worse than the national gap of 8.4 points that same year. No data for this segment was been reported in 2017, and 2019.
Philadelphia's high-income households demonstrate remarkable improvement compared to peer cities:
- Proportion of Philadelphia high-income households (84.8% in 2019, up from 71.6% in 2015) saving for emergencies nearly matched Detroit’s (85.5% in 2019, up from 76.7% in 2015). It is critical to note that this segment in Detroit showed a more dramatic 15.0 point advantage above its city average in 2019 compared to Philadelphia's 7.5 point advantage.
- Philadelphia high-income households outperformed those in Chicago (79.1% in 2019, up from 71.2% in 2015) by 5.7 percentage points in 2019, an increase from just a 0.4 point advantage in 2015.
- The gap in the proportion of high and middle-income households in Philadelphia that were saving for emergencies (12.1 points in 2017) was more pronounced than in Chicago (3.3 points in 2017), pointing to a middle-class savings challenge that warrants attention.
Racial Disparities Show Varied Patterns
Nationally, Black households showed modest improvement, with the gap narrowing from 15.9 percentage points below average in 2015 to 15.4 points in 2019, while Hispanic households made more substantial progress, narrowing from 18.7 points below average in 2015 to 14.3 points in 2019. White households maintained their advantage across all cities, though with varying magnitudes.
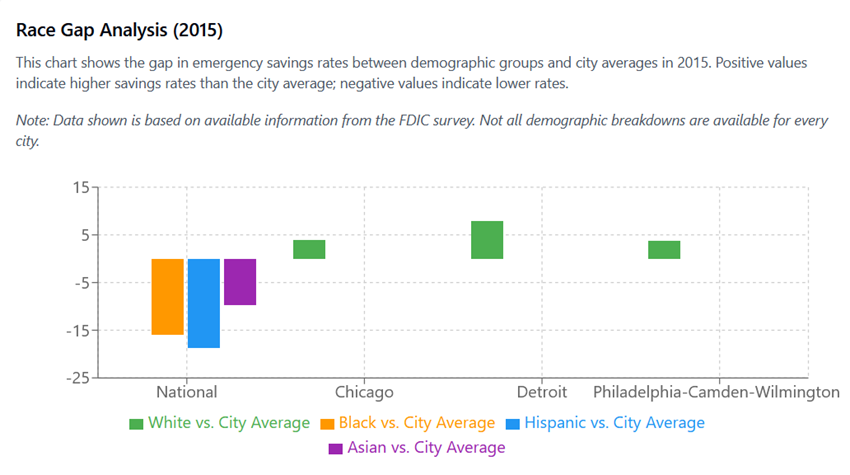
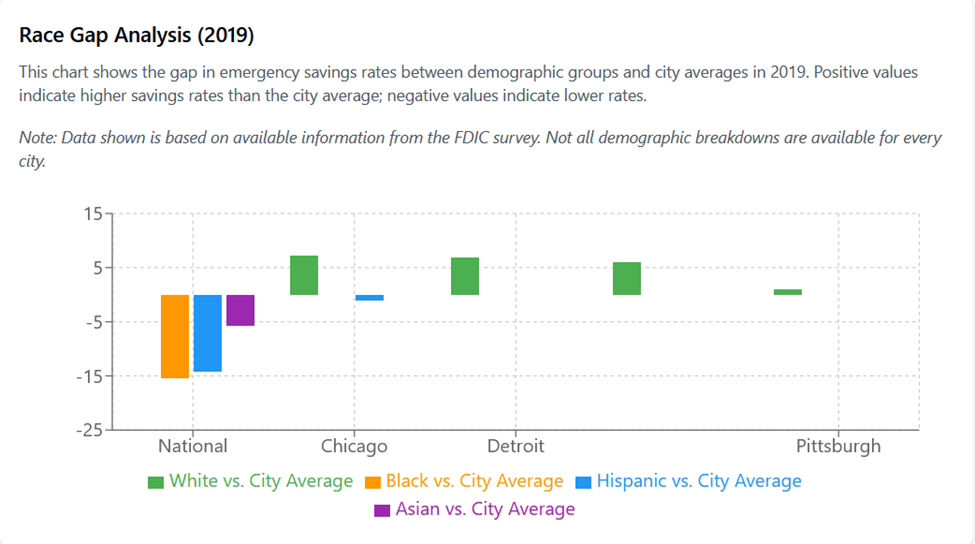
There is almost no data across race for Philadelphia. We do however see distinctive patterns for White household data:
- White households in Philadelphia reported emergency savings at 77.3% in 2019 (up from 61.4% in 2015), placing them 6.0 points above the city average in 2019 compared to 3.7 points above average in 2015.
- The White advantage in Philadelphia increased from 2015 to 2019, suggesting that racial disparities may have widened, though limited data on other racial groups in Philadelphia makes this difficult to confirm conclusively.
- In 2019, a higher proportion of White households in Philadelphia were saving for emergencies (8.7 percentage points) compared to the national average for White households (68.6%). This gap was 0.4 points in 2015.
When comparing Philadelphia to peer cities on racial patterns:
- Philadelphia White households (77.3% in 2019, up from 61.4% in 2015) outperformed Chicago White households (71.1% in 2019, up from 66.9% in 2015) by 6.2 percentage points in 2019, a dramatic increase from being 5.5 points behind in 2015.
- Philadelphia White households also outperformed Detroit White households (70.5% in 2019, up from 70.2% in 2015) by 6.8 percentage points in 2019, reversing a 8.8 point deficit from 2015.
- While Chicago showed impressive progress in narrowing the Hispanic gap to just 1.1 points below city average by 2019, the lack of comparable minority data for Philadelphia prevents a direct comparison of how effectively each city is addressing racial disparities.
Emerging Age-Based Patterns
Age demographics reveal an interesting generational pattern in financial preparedness, with consistent challenges for older adults across all regions:
- Nationally, young adults (25-34) improved their position from 3.7 percentage points above average in 2015 to 6.5 points above in 2019, while seniors (65+) remained vulnerable at 7.1 points below average in 2019, slightly worse than 5.5 points below in 2015.
- The age gap between youngest and oldest groups widened in most cities over the study period.
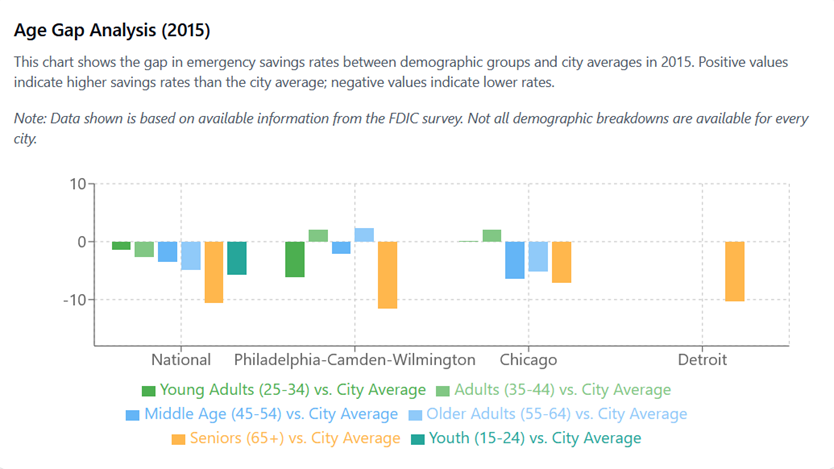
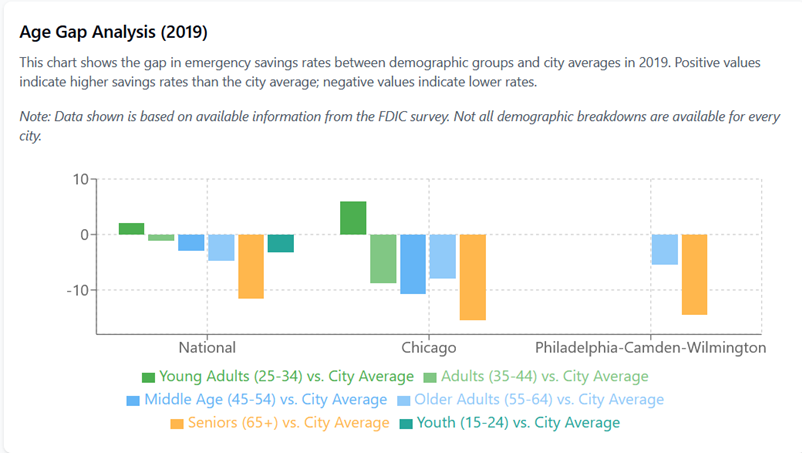
Philadelphia shows notable patterns across age groups:
- A higher proportion of Seniors (65+) in Philadelphia were saving for emergencies (62.8% in 2019 compared to 49.8% in 2015). However, they were still 8.5 points below the city average in 2019, a gap that was wider than the 4.5 point gap in 2017, and 7.9 points gap in 2015.
- Older adults (55-64) in Philadelphia showed savings rates of 71.9% in 2019 (up from 63.8% in 2015), placing them higher than the city average across both years.
- Young adults (25-34) in Philadelphia had savings rates of 55.2% in 2015, placing them 2.5 points below the city average. Unfortunately, data for subsequent years for this segment is unavailable.
Comparing Philadelphia to peer cities on age-based patterns:
- Philadelphia seniors (62.8% in 2019, up from 49.8% in 2015) outperformed Chicago seniors (55.7% in 2019, down from 59.8% in 2015) by 7.1 percentage points in 2019, a dramatic reversal from a 10.0 point deficit in 2015.However, if the gap from the city average is considered - The age disadvantage for Philadelphia's seniors (8.5 points below average) was comparable to Chicago's seniors (8.2 points below average) in 2019. This shows that age-based disparities remain a challenge across metropolitan areas despite Philadelphia's overall stronger financial resilience.
- Additionally, Philadelphia seniors faced a larger disadvantage compared to their city average (8.5 points below) than national seniors (5.5 points below) in 2019.
Factors Influencing Philadelphia's Patterns
Philadelphia’s patterns could be attributed to two key aspects:
- Economic Growth and Job Market Stability - Philadelphia experienced significant economic growth and job market stability during the 2015-2019 period. This economic environment likely contributed to the city's relatively improved performance in emergency savings rates, as stable employment enables households to allocate more resources toward savings (Kahn, 2010). The city's growing industries and declining unemployment rate during this period created favorable conditions for financial resilience building.
- Urban Revitalization Efforts - Philadelphia underwent significant urban revitalization during this period, which may have attracted more affluent residents and improved economic conditions across neighborhoods. While this contributed to higher overall savings rates, it may have simultaneously exacerbated existing disparities if lower-income residents faced increased housing costs or displacement (Lees, 2012). The dual nature of urban revitalization requires careful consideration when interpreting the data.
Recommendations and Future Directions
Designing relevant, inclusive, easy to understand, access and adopt savings products are critical. In order to do so, some essential steps include: Potential solutions to sustain progress and address ongoing challenges include:
- Data is king: Prioritizing capturing comprehensive demographic data (race, gender, income, age, education levels) to gain a clearer understanding of the status, and reasons behind the current patterns of financial resilience across populations.
- Undertake indepth analysis of the specific challenges individuals face across their user experience, and across their lifecycle, to develop targeted solutions.
- Awareness and Understanding of the need and methods to undertake financial health is extremely critical for any resilience building. Given Philadelphia’s cultural landscape, enhance culturally sensitive financial education tailored to underserved communities (United Way of Greater Philadelphia and Southern New Jersey, 2024).
- Build incentives to save: Adopt inclusive financial products, such as the Lubert IDA and Family Savings Account (FSA) Programs, providing matched incentives for low-income savers (Women's Opportunities Resource Center, WORC). Philadelphia can also experiment with micro-savings as a concept/model – that has been vastly used across other nations with roaring success.
- Enhance channels through which individuals can save in a more frequent manner: This would include strengthening and expanding community partnerships with financial institutions through organizations like Finanta and PIDC Community Capital.
Conclusion
Philadelphia’s overall substantial improvements from 2015 to 2019 underscore the transformative impact of coordinated policy actions, targeted education programs, and strategic community partnerships. However, the latest status especially across segments is unknown given the lack of updated data. Financial resilience is key to economic mobility, and designing adequate solutions to support low-income vulnerable segments save more is critical.
To ensure these gains continue and expand equitably, it is critical to enhance data collection practices, and design solutions that allow for improved awareness, access and uptake of financial savings products across segments. By prioritizing these strategies, Philadelphia can maintain its momentum, serving as a powerful model for building lasting financial resilience and economic equity across American cities.
References
- Bankrate. (2025). 2025 Annual Emergency Savings Report. Retrieved from
- CNBC. (2025, February 18). Report: 30% of Americans increased their emergency savings in 2024. Retrieved from
- LiveNowFox. (2025, January 23). Could you handle a $1,000 emergency expense? Report says most Americans can’t. Retrieved from
- U.S. Bureau of Labor Statistics. (2024, October 23). Consumer Expenditures in the Philadelphia Metropolitan Area — 2022–23. Retrieved from
- Federal Deposit Insurance Corporation. (2019). Survey of Household Use of Banking and Financial Services. Retrieved from
- Babiarz, P., & Robb, C. A. (2014). Financial literacy and emergency saving. Journal of Family and Economic Issues, 35(1), 40–50.
- Kahn, L. M. (2010). The economics of labor markets (7th ed.). Addison-Wesley. Note: Ensure this reference matches the actual source used.
- Lees, L. (2012). The urban politics of London: Localism and the London plan. Routledge. Note: Ensure this reference matches the actual source used.
- Lusardi, A., & Mitchell, O. S. (2014). The economic importance of financial literacy: Theory and evidence. Journal of Economic Literature, 52(1), 5–44.