The Proposed H-1B Fee, Occupation by Occupation

How a uniform national charge compares with wages across Greater Philadelphia’s professional workforce
By Saloni Tandon, Director of Research & Analytics; Ziqi Zhou, Research Analyst
Edited by Jeff Hornstein, Executive Director
September 22, 2026
The Department of Homeland Security has proposed a fee of $103,265, payable at filing, on every cap-subject H-1B petition. An H-1B petition is the application an employer files to hire a worker into a role that requires a specialized degree; "cap-subject" means the hire counts against the annual cap of 85,000. The charge is a single national dollar amount. It does not vary with the salary offered, the employer, the industry or the location of the work, so its weight depends entirely on what the position pays.
An Economy League analysis of federal wage data finds the fee is large relative to the pay of the work it would apply to. Across twenty-four occupations spanning the groups that account for most of Greater Philadelphia’s sponsorship, it equals a median of 99.6% of a year’s national median wage, and at least 95% in sixteen of them. Nine of those occupations are examined here in detail, across twenty large metropolitan areas: in five the fee is at least 95% of the national median annual wage for that occupation, in two it exceeds 100%, and for software developers it is 75.9%, the lowest of the nine. The wider set of twenty-four is a check that the result does not turn on which occupations were chosen — and it raises the median rather than lowering it. [1,2]
The nine are the largest occupations by regional employment within the four occupational groups that each account for at least 7% of Greater Philadelphia’s certified H-1B applications. Detailed application counts by occupation are not published, so the nine are illustrative of where the region sponsors rather than a ranked or representative sample. [2,4]
Employers in Greater Philadelphia will be impacted significantly if the proposed rule goes into effect. In most of the nine occupations the region’s median wage tracks closely to the national average, while in two — financial and investment analysts, and data scientists — wages are materially lower and thus the flat fee is correspondingly heavier. This Leading Indicator measures the proposed fee against published occupational wages. It does not establish economic incidence, and it does not estimate employment losses, output effects or a regional fee total.
The comment period closes September 24, 2026
Fee for Certain H-1B Petitions, notice of proposed rulemaking, 91 FR 54817 (August 25, 2026); corrected by a document published September 10, 2026 (FR Doc. C1-2026-17324). Docket USCIS-2026-0298; RIN 1615-AD20. The rule is proposed and is not in effect. DHS expressly invited region- and employer-specific data in response. [1]
What You Need to Know
- In five of the nine occupations examined, the fee equals at least 95% of the national median annual wage. For financial and investment analysts and management analysts it exceeds 100%. For software developers it is 75.9%. [1,2]
- Greater Philadelphia’s median wages across most of the occupations examined tracks closely to national averages. The proposed fee will constitute an entire year’s median pay in most fields. [2]
- Among the twenty metros examined, software developer wages fall into two distinct groups. Seven metros have medians above $150,000, where the fee is 48.5% to 66.7% of a year’s pay. The other thirteen cluster between 74.3% and 79.8%. Philadelphia sits in the middle of the second group. [2]
- Exposure is concentrated in financial and analytical occupations. For financial and investment analysts the fee equals 108.2% of the regional median wage, the second-highest ratio among the twenty metros; for data scientists, 94.0%, the fifth-highest. Business and finance accounts for 9.5% of the region’s certified applications and computing for 61.8%. [2,4]
- In the life sciences, exposure depends on the employer as much as the occupation. In Greater Philadelphia biochemists and biophysicists earn above the national average, but the fee equals 100.3% of the regional median for medical scientists. Institutions of higher education, their affiliated nonprofit entities, and nonprofit or governmental research organizations file cap-exempt petitions the fee would not reach. Exemption follows from that relationship, not from nonprofit status alone: a nonprofit hospital with no qualifying university or research affiliation files cap-subject petitions like any other employer. The wage data cannot identify which institutions would owe the fee. [1,2]
- What this brief does not show: no measure of economic incidence, no job-loss estimate, no output effect, and no regional fee bill. Those require evidence this analysis does not contain.
What This Leading Indicators Adds
Earlier briefs in this series examined higher education and the international student pipeline, foreign-born workers as economic infrastructure, small business exposure, and the July 2026 duration-of-status rule. This brief prices the proposed fee against published occupational wages, across a comparison group fixed in advance rather than chosen for contrast, and reports where Greater Philadelphia falls whether or not the result favors the regional argument that Greater Philadelphia is unusually exposed to the fee. The contribution is an occupational map: the region’s position varies by occupation, and a single regional figure would conceal the variation. We make no claim that no other researcher has examined the geography of immigration fees; we have not conducted a systematic literature review, and the closest published work we identified concerns the distribution of fee revenues rather than fee incidence. H-1B covers specialized temporary employment; it is not a measure of all foreign-born workers. [11–16]
The Fee Measured Against Occupational Wages
Because the charge is fixed, the only thing that varies is the wage it is measured against. Across the nine occupations examined it ranges from 77.0% to 108.2% of a year’s median pay in Greater Philadelphia, and from 75.9% to 101.4% nationally. These nine occupations are illustrative rather than representative. They were chosen as the largest detailed occupations by regional employment within the four groups that account for most of the region’s sponsorship; the disclosure data report occupation at the group level only, so we cannot identify which specific occupations are most frequently sponsored. Because that choice could drive the result, we tested it against fifteen additional occupations across the same groups. The wider set of twenty-four gives a median ratio of 99.6% of a year’s national median wage, above the 97.6% median of the nine reported here — so the figures below understate rather than overstate the charge. Full detail is in the methodology.
Figure 1
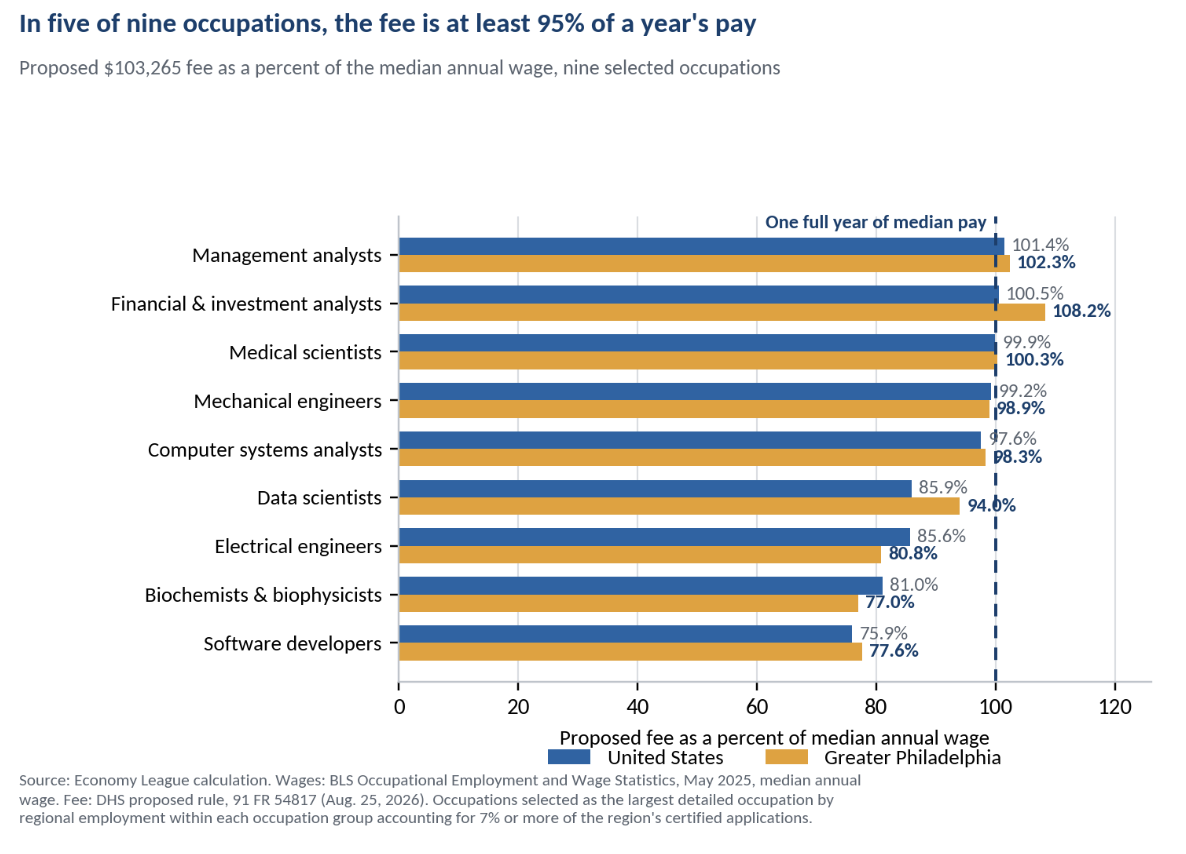
| Greater Philadelphia | United States | |||||
|---|---|---|---|---|---|---|
| Occupation (SOC code) | Group share | Philadelphia median | Fee, 1 yr | Fee, 3 yr | National median | Fee, 1 yr |
| Computer systems analysts (15-1211) | 61.8% | $105,050 | 98.3% | 32.8% | $105,850 | 97.6% |
| Data scientists (15-2051) | 61.8% | $109,910 | 94.0% | 31.3% | $120,230 | 85.9% |
| Software developers (15-1252) | 61.8% | $133,040 | 77.6% | 25.9% | $135,980 | 75.9% |
| Financial & investment analysts (13-2051) | 9.5% | $95,400 | 108.2% | 36.1% | $102,740 | 100.5% |
| Management analysts (13-1111) | 9.5% | $100,920 | 102.3% | 34.1% | $101,860 | 101.4% |
| Medical scientists (19-1042) | 8.6% | $102,950 | 100.3% | 33.4% | $103,410 | 99.9% |
| Biochemists & biophysicists (19-1021) | 8.6% | $134,090 | 77.0% | 25.7% | $127,410 | 81.0% |
| Mechanical engineers (17-2141) | 7.1% | $104,410 | 98.9% | 33.0% | $104,110 | 99.2% |
| Electrical engineers (17-2071) | 7.1% | $127,730 | 80.8% | 26.9% | $120,630 | 85.6% |
Table 1. Economy League calculation. Median annual wages from BLS Occupational Employment and Wage Statistics, May 2025. "Group share" is the share of the region’s certified applications accounted for by the two-digit occupation group containing the listed occupation; detailed application counts by occupation are not available to us, so group shares are the closest available measure of regional relevance. The three-year column divides the fee by three times the median wage and describes a three-year employment scenario, not a present-value calculation. Philadelphia’s rank among the twenty metros by fee-to-wage ratio, where 1 is the highest ratio: financial and investment analysts 2; management analysts 4; data scientists 5; computer systems analysts 6; software developers 7; mechanical engineers 7; medical scientists 11 of 19; electrical engineers 11 of 19; biochemists and biophysicists 15 of 17. Fewer than twenty areas are shown where OEWS suppresses the estimate.
An upfront charge, and a cost that depends on how long the job lasts
Two different questions are easy to conflate. The first is what an employer must finance at the point of filing: the full $103,265, payable at once and in advance of any selection outcome. The second is what the charge amounts to relative to the employment it supports. On a three-year employment scenario the fee falls to 36.1% of the wage bill for a Philadelphia financial analyst, 31.3% for a data scientist and 25.9% for a software developer. Initial H-1B approvals may be granted for shorter periods, and employment may also continue well beyond three years, so this is a scenario rather than a standard term.
Both framings are legitimate and they answer different things. The upfront figure describes a financing problem; the multi-year figure describes the cost of an employment relationship. Neither is a total hiring cost: both exclude benefits, payroll taxes, legal expenses and the other filing fees that already apply. One-year ratios are used for comparison across occupations and places because they are directly comparable. [1,2]
What these ratios do and do not measure
These are comparisons between a proposed fee and an occupation-wide median wage. They are not measures of economic incidence — how the cost would ultimately be divided among employers, workers and customers — which depends on labor market conditions these data do not capture. Nor are occupational medians the wage of any particular sponsored worker: a median spans experience levels, and H-1B offers are separately constrained by prevailing wage requirements that set a floor beneath them. The ratios establish the scale of the charge relative to pay. They do not establish who would bear it.
Comparing Greater Philadelphia With Twenty Large Metros
A uniform charge is larger relative to a smaller salary. Whether that translates into a meaningful regional difference is an empirical question, and we tested it against a comparison group fixed before the wage results were examined: the twenty largest metropolitan areas by employment in computing and mathematical occupations.
Figure 2
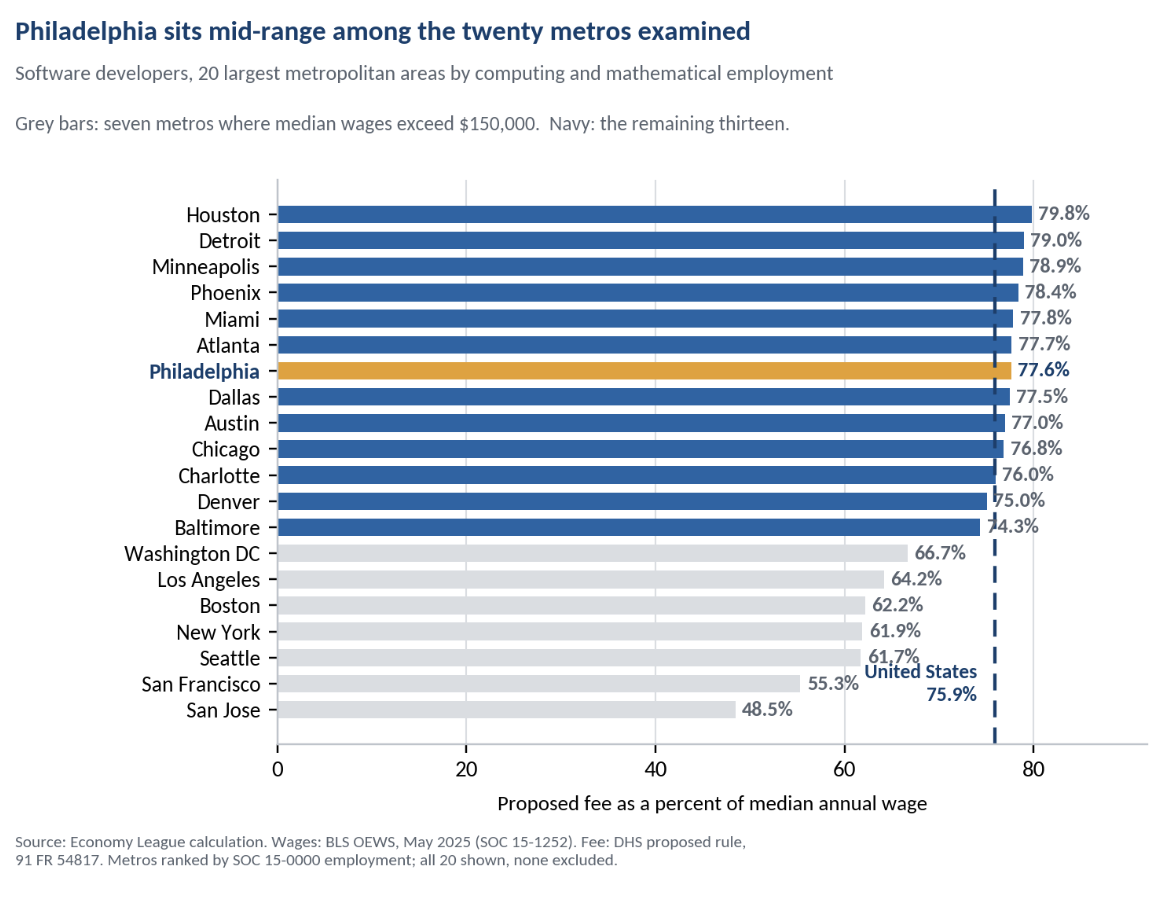
For software developers, the twenty areas fall into two groups with little between them. Seven have median wages above $150,000, and there the fee runs from 48.5% of a year’s pay in San Jose to 66.7% in Washington. The remaining thirteen cluster between 74.3% and 79.8%. Greater Philadelphia, at 77.6%, sits in the middle of that second group, seventh of thirteen, and within two percentage points of the national figure of 75.9%. [2]
Two limits on how far this comparison can be pushed. It describes software developers in this selected sample, not geography in general; the occupational results in Table 1 show that Philadelphia’s position relative to peers differs by occupation. And because the comparison group was chosen by computing employment, it over-represents metropolitan areas with large technology sectors and therefore relatively high wages. It cannot establish how Greater Philadelphia compares with American metropolitan areas as a whole, and if anything it sets a demanding benchmark.
One clarification about local costs. Regional price levels are lower in Philadelphia than in Boston or Seattle, and a natural response is that lower wages simply reflect lower costs. That observation does not change the fee-to-wage ratio: deflating both the fee and the wage by the same local price index leaves the ratio exactly as it was. The narrower point stands without any price index. The charge is denominated in national dollars and is not adjusted for any regional factor. [3]
The lottery and the fee are geographically different instruments
It would be natural to assume that wage-weighted lottery selection, now operating for the first time, works in the same direction as a flat fee against lower-wage regions. It does not. The weighted selection rule assigns lottery entries by the OEWS wage level for the occupation and the area of intended employment, so equivalent wage levels are weighted equally across locations. A Level IV role in Philadelphia receives four entries, exactly the same as a Level IV role in Seattle. DHS addressed this directly, stating that the rule takes the area of intended employment into account when weighting registrations and will not disproportionately advantage or disadvantage registrants in particular geographic areas. [7]
Lower nominal wages alone therefore do not establish worse lottery prospects. Nor do they establish better ones: actual regional outcomes depend on how a region’s registrations are distributed across wage levels and on other selection characteristics, none of which these data capture. The geographic effects of the lottery and of the proposed fee require separate analysis and should not be added together. [2,7]
Where the Region’s Position Varies by Occupation
Because the fee is flat, the region’s exposure in any occupation depends on how its wages compare with wages elsewhere. That comparison is mixed, and the variation is the finding.
Figure 3
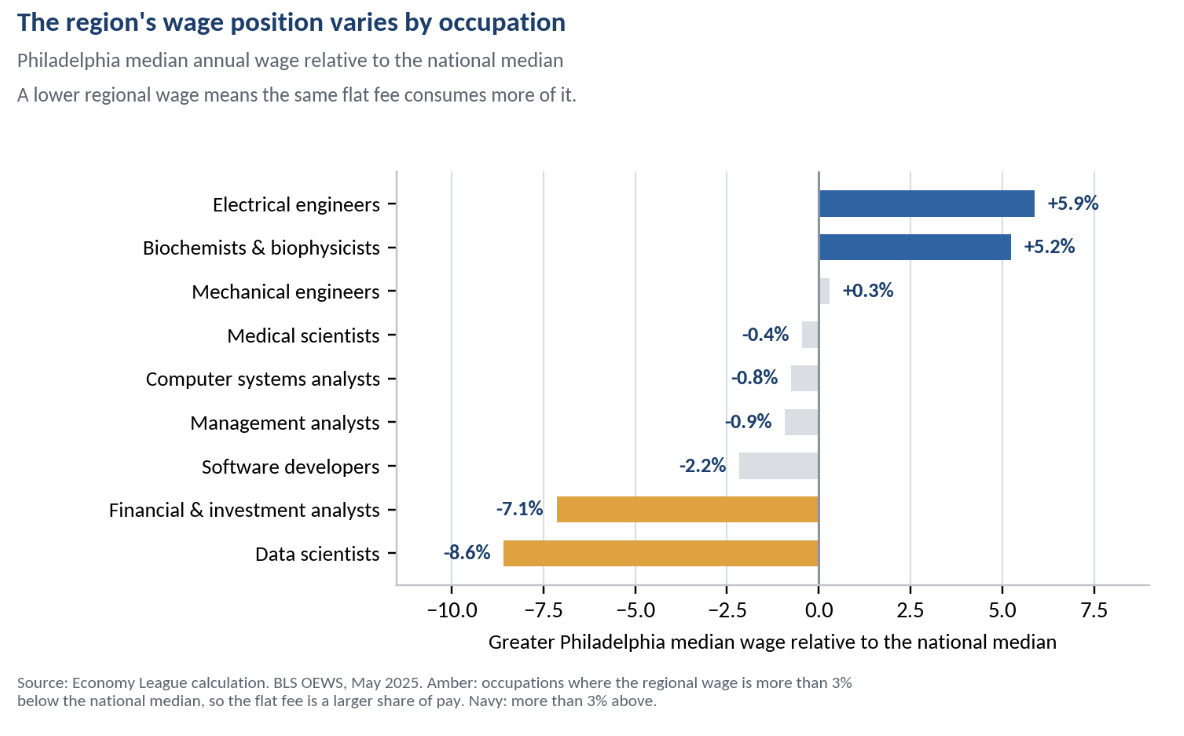
Greater Philadelphia pays above the national median for biochemists and biophysicists, by 5.2%, and for electrical engineers, by 5.9%, so the flat fee is a smaller share of pay here than nationally in both. Medical scientists, mechanical engineers, management analysts, computer systems analysts and software developers all sit within about two percentage points of the national wage. Two occupations stand apart: financial and investment analysts, where the regional median is 7.1% below national and the fee reaches 108.2% of a year’s pay, and data scientists, 8.6% below national at 94.0%. Among the twenty metros, Philadelphia ranks second and fifth respectively on those two. [2]
Both sit inside the region’s real sponsorship activity rather than at its margins. Business and finance accounts for 9.5% of certified applications and computing for 61.8%, though detailed counts by occupation within those groups are not available to us and the group shares should not be read as counts for the specific occupations listed.
| Occupation group, Greater Philadelphia | Certified applications | Share |
|---|---|---|
| Computing and mathematics | 2,651 | 61.8% |
| Business and finance | 409 | 9.5% |
| Life, physical and social sciences | 370 | 8.6% |
| Architecture and engineering | 303 | 7.1% |
| Other occupations | 296 | 6.9% |
| Health practitioners and technical | 141 | 3.3% |
| Education and libraries | 123 | 2.9% |
| Total | 4,293 | 100.0% |
Table 2. Economy League analysis of DOL Office of Foreign Labor Certification, FY2026 Q3 LCA disclosure file; certified single-worksite H-1B applications, October 2025–June 2026. Occupation groups use two-digit SOC codes. Components may not sum exactly because of rounding.
Exposure in life sciences depends on the employer, not only the occupation
It would be tempting to read the biochemistry result as evidence that the region’s life-sciences sector is shielded. The data do not support that. Two relatively well-paid occupations do not characterize a sector, and Table 1 puts the fee at 100.3% of the regional median for medical scientists — a full year’s pay. Nor do occupational medians, which pool all employers, establish what academic or research institutions specifically pay.
The separate and firmer point is eligibility. The proposed fee would not apply to cap-exempt petitions. DHS notes that many cap-exempt H-1B workers are employed by nonprofit research organizations, governmental research organizations and educational institutions, but exemption attaches to the petition rather than to the employer, so an eligible institution filing a cap-subject petition would owe the fee. Institutions of higher education, their affiliated nonprofit entities, and nonprofit and governmental research organizations file cap-exempt petitions that the proposed fee would not reach at all, and colleges and universities accounted for 5.8% of the region’s certified applications. But exposure within life sciences depends on the employer’s eligibility and on the individual petition as well as on the occupation’s pay, and regional occupational medians cannot identify which institutions would owe the fee. [1,4]
Who Would Pay, and on What Margin
The proposed fee reaches cap-subject petitions, including those selected under the advanced-degree allocation. Extensions, amendments and transfers for workers already counted against the cap fall outside it, as do cap-exempt filings. Because the proposed fee would apply to all cap-subject petitions with no exception based on the worker’s location, it would reach a qualifying graduate already in the United States who is selected in the cap — unlike the separate $100,000 entry payment. [1]
A flat per-petition charge does not spread across filings. It repeats with each qualifying petition and is payable in full at filing.
| Chargeable petitions | Fee payable | Equivalent at the national median software developer wage |
|---|---|---|
| 1 | $103,265 | About nine months of pay |
| 5 | $516,325 | About 3.8 years of pay |
| 25 | $2,581,625 | About 19 years of pay |
Table 3. Illustrative arithmetic on the proposed fee schedule. These are hypothetical counts of chargeable petitions, not observed liabilities for any employer or group of employers. Certified labor condition applications are not petitions, not all petitions are cap-subject, and the data do not identify which filings would be chargeable.
The regional data cannot say how chargeable petitions are distributed across employers. What they show is the shape of the filing base. Greater Philadelphia’s 4,293 certified single-worksite applications came from 1,566 reporting employer entities; entities filing between one and five accounted for 2,151 of them, or 50.1%, and the ten largest filers for 1,061, or 24.7%. In Seattle, low-volume filers account for 13.6% and the ten largest for 72.6%. [4]
That contrast should be read carefully. Boston’s ten largest filers account for 18.9% of its applications, which is less concentrated than Philadelphia’s 24.7%. Across these three metros the only clear finding is that Seattle is unusually concentrated. Three comparison points cannot establish that Philadelphia’s filing base is unusually broad, and we do not claim it is. Extending the comparison to the full peer group would require metro-level processing of the disclosure file that we have not undertaken.
Whether filing volume bears on how the charge is absorbed is a question rather than a result. An employer filing once faces an indivisible payment with no portfolio across which to reallocate; an employer filing at volume faces a larger total but can prioritize among positions. Neither response is observable in these data, and filing volume is not a measure of employer size or financial capacity. What is on the record is DHS’s own initial regulatory flexibility analysis, which concedes a significant economic impact on 11,051 small entities — 76% of the small entities that filed cap-subject petitions in FY2025 — and identifies no alternative that would reduce that burden. [1]
The Fee Would Not Arrive Alone
Several measures are moving at once, at different stages of legal force. Conflating them is the most common error in current coverage. As of September 20, 2026 the picture is as follows.
| Measure | Status as of September 20, 2026 |
|---|---|
| $103,265 cap-subject fee | Proposed. 91 FR 54817 (Aug. 25, 2026), corrected Sept. 10. Comments close Sept. 24, 2026. Not in effect. [1] |
| $100,000 entry payment | Implementing guidance vacated nationwide by the U.S. District Court for the District of Massachusetts in State of California v. Mullin (June 8, 2026). Judge Sorokin granted summary judgment to the plaintiff states and vacated the payment requirement in its entirety on June 8, 2026 (No. 1:25-cv-13829, D. Mass.), in a suit filed 12 December 2025 by California and 19 other states.; the First Circuit denied a stay pending appeal on July 24, 2026. Extended twelve months by proclamation on Sept. 18, 2026. Not currently collectable; appeal pending. Two further challenges are pending — Chamber of Commerce v. DHS, No. 25-5473 (D.C. Cir.), and Global Nurse Force v. Trump, No. 4:25-cv-08454 (N.D. Cal.) — both reportedly held pending the outcome in Mullin. Merits briefing in the First Circuit was expected to conclude October 16, 2026. [5,6] |
| Wage-weighted lottery selection | In effect. Final rule at 90 FR 60864 (Dec. 29, 2025), effective Feb. 27, 2026; first applied in the FY2027 cap season. Wage levels are set by occupation and area of intended employment. [7] |
| Prevailing-wage increase | Proposed. Improving Wage Protections for the Temporary and Permanent Employment of Certain Foreign Nationals in the United States, 91 FR 15454 (March 27, 2026); comments closed May 26, 2026. Would raise the Level I wage from the 17th to the 34th percentile of the local occupational distribution. [8] |
| Program integrity executive order | Issued Sept. 18, 2026. Directs agencies to weigh employer layoff history in reviewing labor condition applications, petitions and entry. [9] |
| Biometric entry-exit fee expansion | CBP 9-11 Response and Biometric Entry-Exit Fee final rule, 91 FR 51360 (August 10, 2026), expands the statutory 9-11 Biometric Fee to require covered employers to pay it on all H-1B and L-1 extension-of-stay petitions, regardless of whether a Fraud Fee applies or whether there is a change of employer. The statutory fee is scheduled to sunset September 30, 2027 unless reauthorised. [10] |
Table 4. Compiled from the sources listed. Status verified September 20, 2026; confirm immediately before publication.
The lottery and the prevailing-wage rule both operate on locally defined wage benchmarks, while the fee is a uniform national dollar amount. Their geographic effects therefore differ in kind and should be assessed separately. What they share is direction with respect to pay: within any given labor market, each bears more heavily on lower-paid petitions.
A question worth raising during the comment period
DHS assumes an annual filing volume of 85,000 cap-subject petitions and multiplies that by the fee to project $8,777,525,000 in annual revenue. The 85,000 figure is the statutory ceiling on grants of initial H-1B status, not a forecast of filings, and recent cap-subject receipts have run above it. The rule’s own elasticity appendix reports that initial consular H-1B receipts fell 91.2% following the 2025 proclamation. The useful question for commenters is how sensitive the revenue projection is to chargeable demand falling below 85,000, and how the composition of participating employers might shift even if the cap continues to fill. A decline in one recruitment route cannot be read directly as a decline in total cap-subject demand. [1]
What a Decline in Sponsorship Would, and Would Not, Mean
A fee is a transfer from an employer to the government. It is not automatically an equal loss of regional output. What a region loses, if anything, depends on what replaces the intended hire. This section concerns what happens after a sponsorship does not proceed. It is not an assessment of whether the H-1B program benefits the region or the economy, and this brief takes no position on that question. The empirical literature below documents three distinct responses with different regional consequences:
- Substitution. Doran, Gelber and Isen, using the FY2006 and FY2007 visa lotteries matched to tax and patent records, find that firms that lost employed roughly 1.5 more other workers for each visa they did not receive, while winning additional visas had insignificant and at most modest effects on firm innovation. That is evidence against treating every forgone sponsorship as a lost job. It measures the marginal visa at firms already filing. [17]
- Offshoring. Glennon finds that restrictions on H-1B access led U.S. multinationals to expand employment at foreign affiliates — on the order of 0.4 affiliate jobs per unfilled H-1B for the average multinational, rising to roughly 0.9 for the most globalized firms. This response requires pre-existing foreign affiliates and is unavailable to purely domestic employers. [18]
- Screening before selection. The Penn Wharton Budget Model, modelling the separate $100,000 entry payment, notes that a registration subject to the payment enters the lottery only if the employer is willing to pay, and finds that exposure concentrates on lower-paid, bachelor’s-degree workers in computer occupations — the same group the weighted lottery and the proposed prevailing-wage increase also disadvantage. It projects that most of the resulting increase in selected pay comes from the weighting rather than from the payment. [19]
Three limits apply. The substitution result compares H-1B workers with other workers at the same firm, and "other workers" includes people employed on OPT, L-1 and similar authorizations as well as U.S. citizens and permanent residents; it is not a finding that visa holders replace workers who need no visa. It is also a firm-level result — the authors note that workers not hired at one firm may be employed at another — so it does not establish displacement in the labor market as a whole. And all three studies concern earlier policies and different firms: the lottery estimate is identified by random loss among employers that had already filed, whereas a large fee acts on the decision to file at all. None estimates the effect of the proposed fee, and none is specific to Greater Philadelphia. What they establish is that more than one employer response is plausible, and that a reduction in sponsorship cannot be converted into a count of lost jobs without evidence about what followed it.
What the Region Should Watch
| Indicator | The question it raises |
|---|---|
| Certified applications and the number of participating employer entities | Compare equivalent quarters. Does any decline appear in the number of distinct filers, in applications per filer, or both? Either measures sponsorship activity, not employment. [4] |
| Regional employment and wages in the occupations identified here | If sponsorship falls while employment and pay in financial, analytical and computing occupations hold steady, that is consistent with substitution but does not establish it. Persistent vacancies or rising wages would be consistent with unmet demand. Neither pattern rules the other out. [2] |
| The cap-exempt share of regional filings | Does a rising exempt share reflect growth at universities and affiliated institutions, or a fall in cap-subject activity? The two have different implications and the share alone cannot distinguish them. |
| Announced facility, research and affiliate decisions | Relocation appears in location announcements rather than in application counts. Record the destination and the stated reason, and treat individual cases as cases. |
| Legal and regulatory status | Which measures are enforceable, which are proposed, and which are interrupted by court order? The applicable rule depends on the petition and its date. [1,5–8] |
Table 5. Economy League. Where a regional measure is unavailable, it should be reported as unavailable rather than as zero.
What the Evidence Supports Now
The proposed fee would represent a larger addition relative to wages than a focus on the highest-paid sponsored occupations suggests: in five of the nine occupations examined it equals at least 95% of a year’s national median pay. Greater Philadelphia’s position varies across those occupations rather than sitting uniformly above or below its peers — close to the national median in most, materially below in financial and analytical roles, above it in biochemistry and electrical engineering. The region’s certified application activity is also spread across a broad base of filing entities.
Together these findings support monitoring which employers continue sponsoring and which occupations they seek to fill. They do not establish how many employers would pay the fee, nor how regional employment would change, nor that Greater Philadelphia is either uniquely disadvantaged or uniquely protected. The useful contribution is the variation itself: a single regional average would conceal the occupations where the charge is heaviest.
In the immediate term the comment period is the actionable window. DHS invited region- and employer-specific evidence, the record closes on September 24, and arguments not raised in it are considerably harder to raise later.
What a regional comment could put in the record
The range across occupations. In five of nine occupations examined the fee equals at least 95% of a year’s national median pay. Evidence on that range belongs in the record; every wage figure here is reproducible from published BLS data.
Revenue sensitivity. How far does the $8.8 billion projection fall if chargeable demand drops below 85,000, and how would the mix of participating employers change even if the cap fills?
Interaction with the prevailing-wage proposal. Neither rule’s analysis accounts for the other, although both bear on the same lower-paid petitions.
The distribution of filing activity. Half of this region’s certified applications come from entities filing five or fewer. Whether those filers are small entities is not observable in the disclosure data, and DHS’s own small-entity finding would benefit from regional evidence on the point.
How We Conducted the Analysis
Wages and fee ratios. Median annual wages are from the BLS Occupational Employment and Wage Statistics program, May 2025, retrieved through the BLS public API on September 20, 2026. Ratios divide the proposed $103,265 fee by the published median. Three-year figures divide by three times the median and describe a three-year employment scenario; they are not present-value calculations, apply no discount rate, and do not assume any particular approval period. OEWS medians describe all workers in the occupation and area, not H-1B workers specifically, and span experience levels. The full extract underlying every figure in this brief is available as a companion data file.
Comparison group, fixed in advance. The peer set is the twenty largest metropolitan areas by employment in computing and mathematical occupations (SOC 15-0000), May 2025. The rule was set before the wage results were examined, all twenty are reported, and none was excluded. Because the group is selected on computing employment it over-represents metropolitan areas with large technology sectors, and therefore relatively high wages; it cannot establish how Greater Philadelphia compares with American metropolitan areas generally. Where an occupation is suppressed in OEWS for an area, the number of areas with published data is reported alongside the rank. Earlier drafts of this analysis compared Philadelphia only with Boston and Seattle; both fall in the high-wage group identified in Figure 2, and that comparison overstated the regional contrast.
Occupation selection. We identified the two-digit occupation groups accounting for 7% or more of the region’s certified applications — computing and mathematics, business and finance, life, physical and social sciences, and architecture and engineering — and selected within each the largest detailed occupations by regional employment with published wage data. Selection was therefore made on regional employment, not on detailed shares of sponsored applications, which are not available to us. The nine occupations are illustrative of the groups that account for most regional sponsorship. They are not the most frequently sponsored occupations, and they are not a representative sample of sponsored work. Establishing either would require detailed occupation counts from the disclosure file, which report at the group level only.
Sensitivity to that selection. Because the choice of occupations could drive the result, we tested it. We added fifteen further detailed occupations across the same four groups — software quality assurance analysts, computer programmers, information security analysts, computer network architects, computer and information research scientists, operations research analysts, statisticians, accountants and auditors, market research analysts, biological scientists, chemists, microbiologists, and industrial, chemical and civil engineers — for twenty-four in total. Across all twenty-four, the fee equals a median of 99.6% of a year’s national median wage and at least 95% in sixteen. The original nine have a median of 97.6%; the fifteen added have a median of 102.4%. Widening the set therefore raises the measured burden, so the figures reported in the brief are the conservative ones. Greater Philadelphia’s median across the same twenty-four is 99.4%, against 99.6% nationally, consistent with the finding that the region is not an outlier. Computer user support specialists were tested and excluded: the fee equals 166.9% of the national median wage for that occupation, but the role rarely qualifies as a specialty occupation, and including it would inflate the range without informing the question.
A constructed summary figure, reported here rather than in the findings. Averaging the occupational ratios within each group and weighting the groups by their share of the region’s certified applications gives 91.5% using Philadelphia wages and 88.9% using national wages. This is an index, not an observed average across sponsored workers. Both figures use Philadelphia’s occupational-group weights, so the 88.9% figure is not a measure of the national sponsorship mix; detailed occupations are weighted equally within each group regardless of their actual application counts; and the four groups cover about 87% of regional applications, rescaled to 100%. We report it for transparency and do not rely on it.
Why OEWS rather than listed application wages. Wages listed on labor condition applications are available for the same period and produce a similar ordering at lower levels. We report OEWS because it is the source the Labor Department uses to construct prevailing wage levels, because any reader can reproduce it, and because it reflects the occupation’s market wage rather than the lower bound of a listed range.
Regional price levels. BEA regional price parities, all items, 2023 (Philadelphia 103.5, Boston 111.6, Seattle 113.0; United States = 100). Reported descriptively only. Deflating both the fee and the wage by the same local index leaves the fee-to-wage ratio unchanged, so price parities neither strengthen nor weaken the central comparison, and they do not explain why wages differ across metropolitan areas.
Sponsorship structure. Labor Department Office of Foreign Labor Certification FY2026 Q3 disclosure file, covering decisions from October 1, 2025 through June 30, 2026. We retained records classified as H-1B with case status Certified and restricted the sample to applications reporting exactly one worksite. Records were assigned to metropolitan areas by worksite state and county under the July 2023 Census delineations. Greater Philadelphia comprises Bucks, Chester, Delaware, Montgomery and Philadelphia counties in Pennsylvania; Burlington, Camden, Gloucester and Salem in New Jersey; New Castle in Delaware; and Cecil in Maryland. Each application carries a weight of one; a single application may request multiple positions. Employer entities are grouped by federal employer identification number and were not consolidated into parent companies. Including multi-worksite applications, assigned by first listed worksite, raises the regional sample to 7,859 and lowers the one-to-five share to 42.7%.
Illustrative fee scales. Table 3 multiplies the proposed fee by hypothetical counts of chargeable petitions. These are not observed liabilities and are not attributed to any type of employer. We do not publish an aggregate regional fee estimate: the data identify labor condition applications rather than cap-subject petitions, a single application can cover several positions, and no reliable bound in either direction can be derived from them.
What we cannot see. Four gaps bound what any regional analysis can currently establish. The disclosure data identify applications rather than petitions, so the cap-subject share of regional activity — the only population the fee would reach — cannot be determined, nor can detailed occupation counts be matched to the wage analysis. Employer size and financial capacity are not reported, so the small-entity concession cannot be localized. Beneficiary location is not reported, so overlap with the separate entry payment cannot be measured. And no public series links regional sponsorship to subsequent hiring, so substitution, vacancy and relocation cannot be distinguished after the fact.
Limits. Certification is a labor attestation step. It is not an approved petition, a visa issuance, a unique worker or a completed hire. The analysis measures a proposed fee against published wages; it does not establish economic incidence, determine fee liability for any employer, or estimate employment or output effects. The period overlaps other policy changes and is not an untreated baseline. National payment and consular figures cited in the policy table are administration-reported summaries rather than independently reproduced estimates. Percentages are rounded. Policy status was verified September 20, 2026; confirm implementation and litigation status immediately before publication.
Sources and Related Leading Indicators
- [1] U.S. Department of Homeland Security, U.S. Citizenship and Immigration Services. Fee for Certain H-1B Petitions. Notice of proposed rulemaking, 91 FR 54817, August 25, 2026; correction, 91 FR 57516, September 10, 2026. Docket USCIS-2026-0298; RIN 1615-AD20.
- [2] U.S. Bureau of Labor Statistics. Occupational Employment and Wage Statistics, May 2025. Metropolitan and national estimates retrieved via the BLS public API, September 20, 2026. Full extract supplied as a companion data file.
- [3] U.S. Bureau of Economic Analysis. Regional Price Parities by metropolitan area, all items, 2023.
- [4] U.S. Department of Labor, Office of Foreign Labor Certification. Performance data, FY2026 Q3 Labor Condition Application disclosure file, decisions October 1, 2025 through June 30, 2026.
- [5] The White House. Restriction on Entry of Certain Nonimmigrant Workers. Proclamation 10973, September 19, 2025, 90 FR 46027; extended by proclamation September 18, 2026.
- [6] State of California v. Mullin, No. 1:25-cv-13829 (D. Mass., June 8, 2026); motion for stay pending appeal denied, No. 26-1699 (1st Cir., July 24, 2026).
- [7] U.S. Department of Homeland Security. Weighted Selection Process for Registrants and Petitioners Seeking To File Cap-Subject H-1B Petitions. Final rule, 90 FR 60864, December 29, 2025. USCIS FY2027 cap season announcements.
- [8] U.S. Department of Labor. Improving Wage Protections for the Temporary and Permanent Employment of Certain Foreign Nationals in the United States. Notice of proposed rulemaking, March 27, 2026.
- [9] The White House. Enhancing Program Integrity and Interagency Coordination in the Administration of the H-1B Nonimmigrant Visa Program. Executive order, September 18, 2026.
- [10] U.S. Department of Homeland Security. 9-11 Response and Biometric Entry-Exit Fee. Final rule, 91 FR 51360, effective September 9, 2026.
- [11] Neil G. Ruiz and Jill H. Wilson. Better Align H-1B Visa Fee Revenues to Local Workforce Needs. Brookings Institution, 2013.
- [12] Center for Strategic and International Studies. Practical H-1B Reforms to Serve U.S. Economic Interests. 2026. csis.org/analysis/practical-h-1b-reforms-serve-us-economic-interests
- [13] Economy League of Greater Philadelphia. Federal Immigration Policy and Higher Education: The Impact on Students, Institutions, and the Greater Philadelphia Talent Pipeline. May 2026.
- [14] Economy League of Greater Philadelphia. Immigration as Economic Infrastructure: How Foreign-Born Workers Sustain Philadelphia’s Growth and Key Sectors.
- [15] Economy League of Greater Philadelphia. How New Federal Immigration Policies and Practices Are Impacting Small Businesses in Greater Philadelphia.
- [16] Economy League of Greater Philadelphia. A New Federal Rule Brings Up to $7.4 Million in Annual Costs — and Wider Talent Risks. July 2026.
- [17] Kirk Doran, Alexander Gelber and Adam Isen. The Effects of High-Skilled Immigration Policy on Firms: Evidence from Visa Lotteries. Journal of Political Economy 130(10), 2022, 2501–2533.
- [18] Britta Glennon. How Do Restrictions on High-Skilled Immigration Affect Offshoring? Evidence from the H-1B Program. Management Science 70(2), 2024, 907–930.
- [19] Penn Wharton Budget Model. Effects of the New $100,000 Fee and Wage-Weighted Lottery on the H-1B Visa. August 3, 2026. budgetmodel.wharton.upenn.edu/p/2026-08-03-effects-of-the-new-100000-fee-and-wage-weighted-lottery-on-the-h-1b-visa/
Publication note. Wage figures are Economy League calculations from source [2]; the complete BLS extract is supplied alongside this brief so that every ratio and rank can be checked independently. Regional sponsorship figures are from source [4]. Policy status was verified September 20, 2026. Because the comment period closes September 24 and litigation over the separate entry payment remains active, recheck implementation and legal status immediately before release.

