13. Urban Income Dynamics: Diverging Paths in America's Post-Industrial Cities [2014-2024]
Philadelphia's economic transformation over the past decade reflects broader patterns of urban restructuring, yet the city's trajectory reveals unique challenges that distinguish it from peer metropolitan areas. Leveraging the latest ACS data release, this analysis examines household income trends across Philadelphia, Chicago, Detroit, and Pittsburgh from 2014 to 2024, uncovering critical insights about economic resilience, growing inequality, and the persistence of racial income disparities.
What you need to know:
• Chicago leads in absolute wealth but exhibits the most extreme polarization – With mean household income reaching $119,993 in 2024, Chicago outpaces Philadelphia ($88,901) by 35%. However, this masks severe economic stratification: 15.5% of Chicago households earn over $200,000 while 24.7% earn less than $35,000, creating a polarization index that dwarfs peer cities.
• Philadelphia's middle class shows resilience compared to peers – While all cities experienced middle-income erosion, Philadelphia retained 38.3% of households in the $35,000-$100,000 range (2024), compared to Chicago's 34.2%. This suggests Philadelphia's economic restructuring has been less extreme, though the trend toward bifurcation continues.
• Detroit's poverty concentration remains acute despite improvement – With 46.3% of households earning below $35,000 in 2024, Detroit's low-income population exceeds Philadelphia's (31.3%) by nearly 50%. The city's mean household income of $56,589 reflects ongoing structural challenges from deindustrialization, though the 52% increase since 2014 indicates momentum.
• Racial income gaps persist with troubling consistency – Across all cities, White households earn 1.7 to 2.5 times more than Black households. Philadelphia's ratio (1.7x in 2024) appears more equitable than Chicago's (2.5x), but this reflects Philadelphia's lower overall income levels rather than genuine equity progress.
• Income inequality has intensified across all cities – Gini coefficients reveal a universal trend toward greater inequality, with Chicago reaching 0.485 in 2024 (up from 0.396 in 2014). Philadelphia's coefficient of 0.448 places it mid-range among peers but still indicates high inequality by national standards.
1. The Diverging Income Trajectories
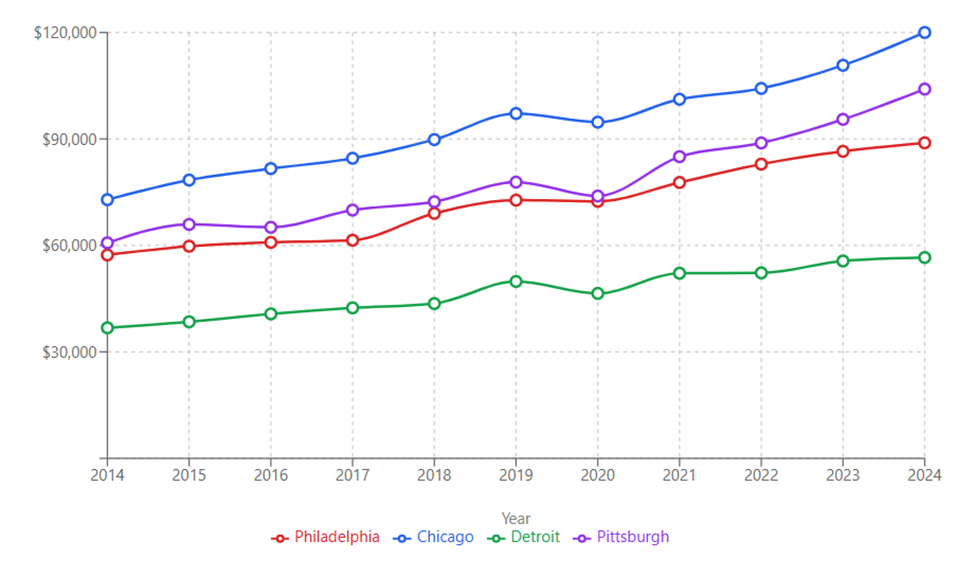
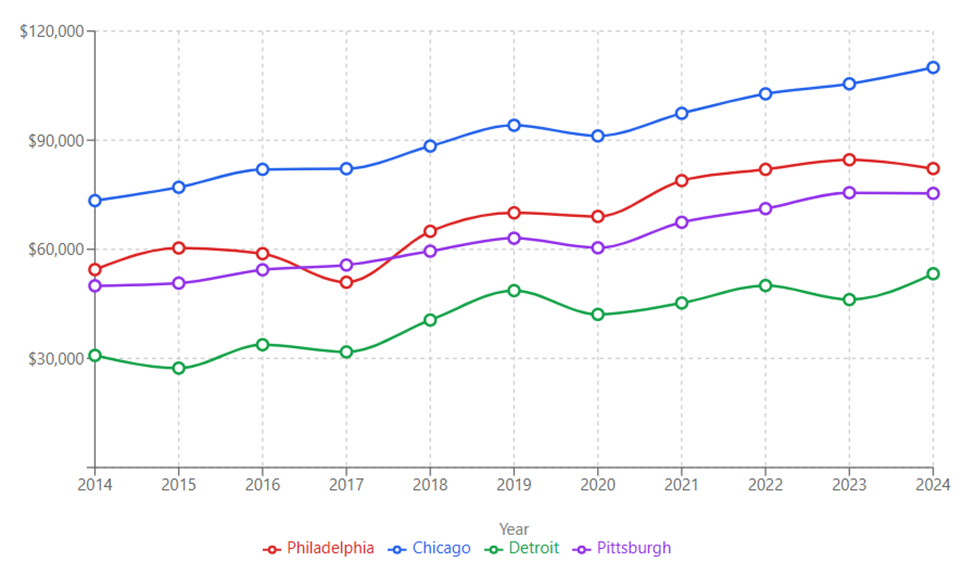
Figure 1: Mean Income
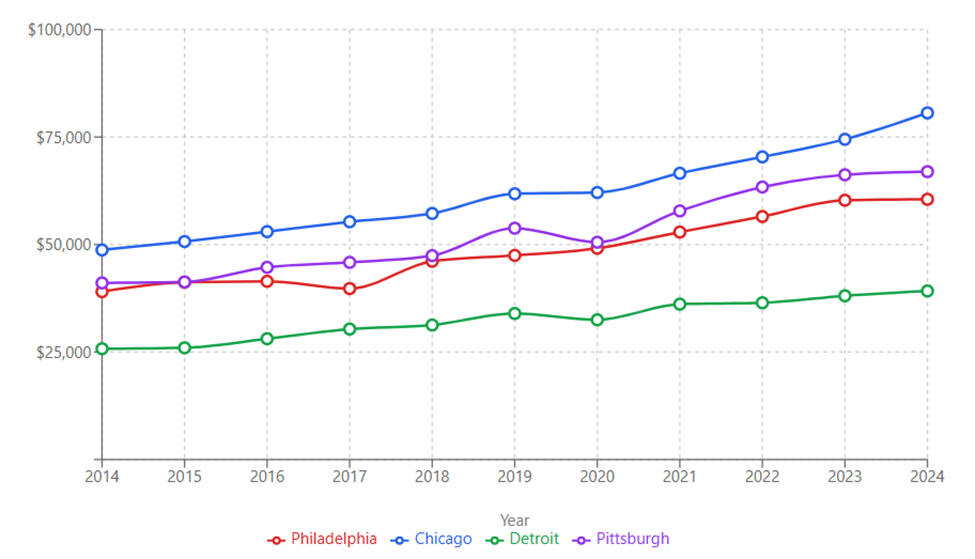
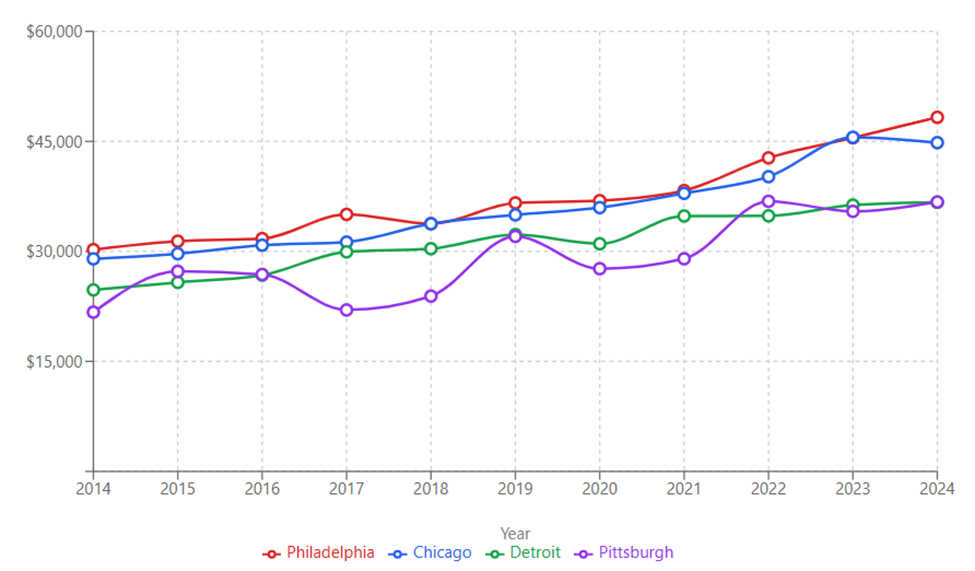
Figure 2: Median Income
The decade from 2014 to 2024 witnessed remarkable divergence in household income growth across these four cities. Philadelphia's mean household income grew from $57,306 to $88,901—a 55% increase that, while substantial, lagged Chicago's 65% growth to $119,993. More revealing is the median income comparison: Philadelphia's median reached $60,521 in 2024, just 75% of Chicago's $80,613, highlighting how mean averages can obscure the typical household's experience.
Pittsburgh emerged as an unexpected success story, with mean income growing 71% to $104,042, surpassing Philadelphia despite its smaller size. This reflects Pittsburgh's successful transition from steel to technology and healthcare, sectors that generate high-wage employment. Detroit, starting from the lowest base, achieved 54% growth but remains constrained at $56,589 mean income—a reminder that percentage gains from a low baseline can overstate absolute progress.
The gap between mean and median incomes provides crucial insight into wealth concentration. In Chicago, the mean-median gap widened to $39,380 by 2024, indicating extreme wealth concentration at the top. Philadelphia's gap of $28,380, while substantial, suggests a less skewed distribution. This pattern holds implications for economic policy: cities with larger gaps face greater challenges in creating broad-based prosperity.
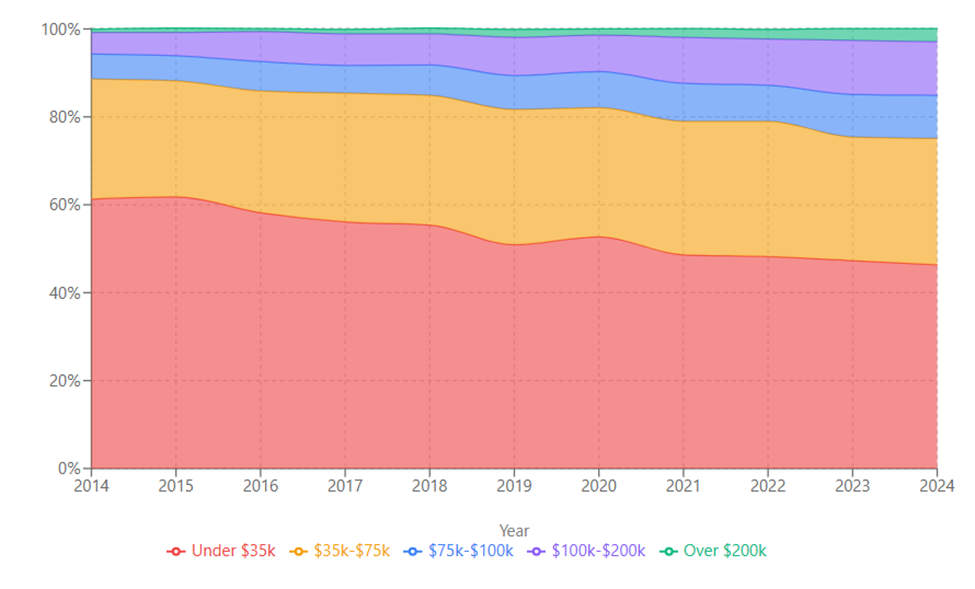
2. The Hollowing Middle: Income Distribution Transformation
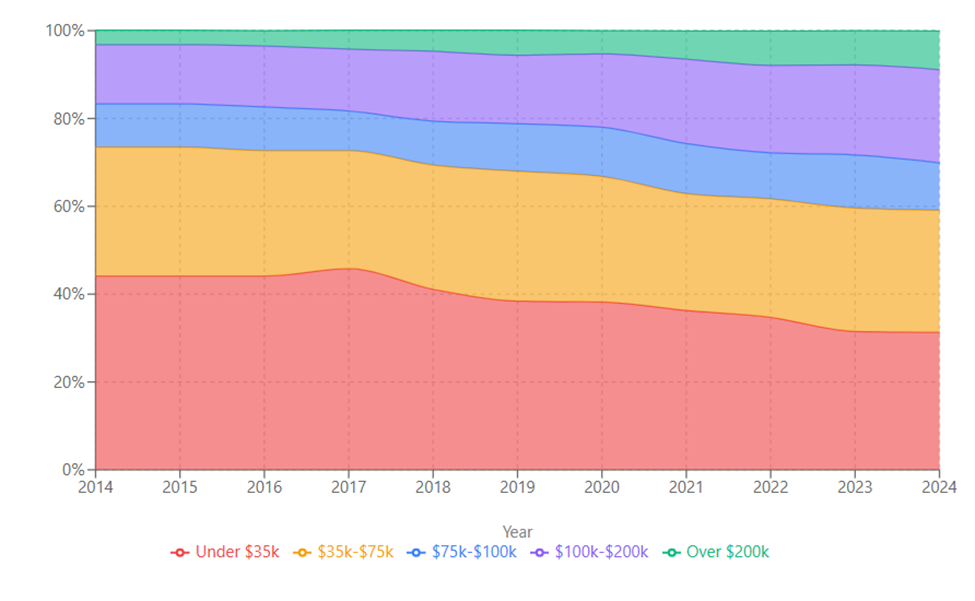
The most striking pattern across all four cities is the erosion of middle-income households, though the severity varies significantly. Philadelphia saw households earning $35,000-$75,000 decline from 29.4% in 2014 to 27.8% in 2024—a modest 5.4% relative decrease. Chicago experienced a sharper decline, from 28.6% to 22.5%—a 21.3% relative decrease that signals aggressive economic polarization.
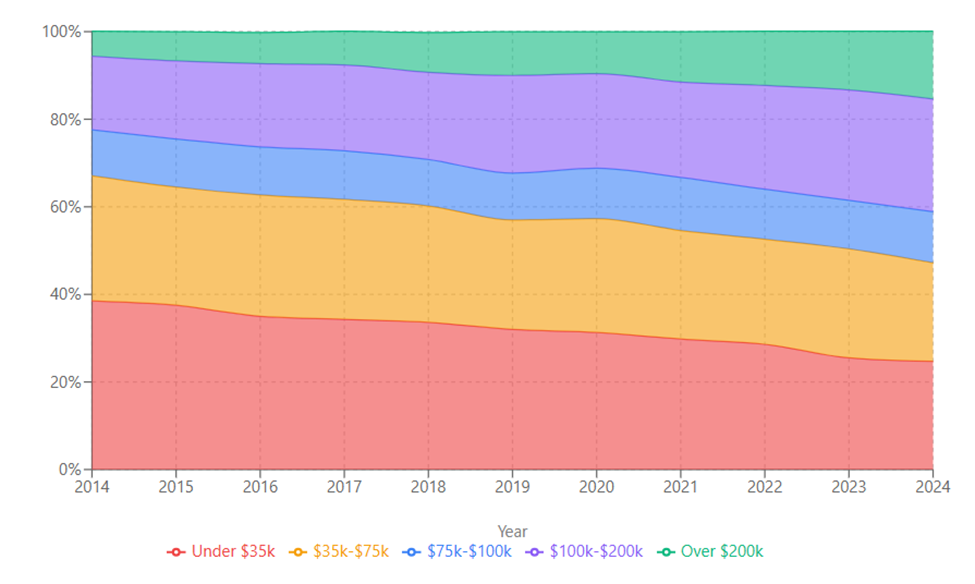
The growth in high-income households tells a parallel story. Philadelphia's households earning over $100,000 increased from 16.8% to 30.0%—a 78.6% relative increase. Yet Chicago's transformation was more dramatic, with this segment growing from 22.5% to 41.2%—an 83.1% increase that now encompasses two-fifths of all households.
Detroit presents a unique pattern: its middle-income segment ($35,000-$75,000) actually expanded slightly, from 27.3% to 28.8%. This countertrend likely reflects Detroit's economic recovery from an extremely depressed baseline, where middle-income growth represents progress rather than polarization. However, with only 15.2% of households earning over $100,000, Detroit remains far from achieving broad prosperity.
3. Racial Income Disparities: Persistent Structural Inequity
The racial income data reveals troubling persistence in economic disparities. In Philadelphia, White households earned $82,191 in 2024 compared to $48,275 for Black households—a ratio of 1.7:1. While this ratio has improved marginally from 1.8:1 in 2014, the absolute gap widened from $24,186 to $33,916, demonstrating how ratios can mask growing dollar disparities.
Chicago exhibits the starkest racial stratification among the four cities. White households earning $109,997 compared to $44,822 for Black households creates a 2.5:1 ratio—the highest among peer cities. The absolute gap of $65,175 represents more than an entire year's median income for many families. Asian households in Chicago, earning $97,290, approach parity with White households, suggesting that racial income dynamics vary significantly by group.
Detroit's racial income patterns reflect its unique demographics as a majority-Black city. The White-Black income ratio of 1.5:1 ($53,277 vs. $36,691) is the lowest among peer cities, though this partly reflects relatively low White household incomes rather than high Black household incomes. The persistence of a gap even in a Black-majority city underscores how structural factors transcend demographic composition.
Pittsburgh shows volatile patterns in racial income data, with significant year-to-year fluctuations suggesting smaller sample sizes. The 2024 White-Black ratio of 2.1:1 ($75,368 vs. $36,735) places it between Philadelphia and Chicago, though the smaller Black population (22.2%) means fewer households benefit from the city's overall economic success.
These local patterns reflect broader national wealth disparities that extend far beyond income alone. According to the U.S. Census Bureau's Survey of Income and Program Participation, households with a White, non-Hispanic householder had 10 times more wealth than those with a Black householder in 2021. While households with a Black householder made up 13.6% of all U.S. households, they held only 4.7% of all wealth. Differences in the composition of wealth can have implications for building wealth and passing it along to future generations, contributing to the persistence of the racial wealth gap. Moreover, the survey also shows that nearly one in four Black households reported zero or negative wealth—compared to just one in twelve White households—leaving Black households especially vulnerable to instability and economic shocks.
4. Income Inequality: The Lorenz Curve Reality
The Lorenz curves and Gini coefficients reveal a universal trend toward greater income inequality, though with important variations. Philadelphia's Gini coefficient rose from 0.381 in 2014 to 0.448 in 2024—a 17.6% increase that indicates significant wealth concentration. The Lorenz curve shows that the bottom 40% of Philadelphia households earn approximately 15% of total income, while the top 20% capture nearly 50%.
Chicago's inequality metrics are the most extreme, with its Gini coefficient reaching 0.485 by 2024—approaching levels typically associated with highly unequal societies. The city's Lorenz curve demonstrates severe concentration: the bottom 50% of households earn just 20% of total income. This level of inequality has profound implications for social cohesion, economic mobility, and political stability.
Detroit and Pittsburgh show intermediate patterns, with Gini coefficients of 0.432 and 0.463 respectively. Detroit's relatively lower coefficient partly reflects compressed incomes at both ends of the distribution—there are fewer extremely wealthy households to skew the distribution. Pittsburgh's rising inequality (from 0.382 to 0.463) represents the largest percentage increase among the four cities, suggesting its economic transformation is creating winner-take-all dynamics.
In addition, these inequality patterns above may be further reinforced by recent federal policy choices that systematically favor high-income households. According to Congressional Budget Office (CBO) projections, the One Big Beautiful Bill Act will increase the resources of the richest one-tenth of households by an average of $13,600 per year over the next decade—a 2.7 percent increase in their projected income—while simultaneously reducing the resources of the bottom one-tenth of households by about $1,200 per year, a 3.1 percent decline. This policy framework essentially shifts resources from households struggling to make ends meet to wealthy households whose after-tax incomes are already far higher and rising more quickly. The broader trend since 1979 shows that incomes of households in the top 1 percent have risen faster than those in the top 5 or 10 percent, with the incomes of the top one-hundredth of 1 percent rising fastest of all, creating a compounding effect that accelerates wealth concentration at the very top of the distribution.
5. Post-Pandemic Trajectories: Divergent Resilience
The 2020-2024 period provides a natural experiment in urban economic resilience. Philadelphia's mean household income grew 15.7% during this period, demonstrating robust recovery from pandemic disruptions. Median income growth of 23.2% suggests broad-based gains rather than concentration at the top. A 2024 report from the Federal Reserve Bank of Philadelphia found that, wage inequality declined slightly nationwide after COVID as higher-paid workers experienced flat or declining real wage growth while low-wage workers saw modest increases due to labor shortages. The Philadelphia–Camden–Wilmington MSA ranked as the 46th most unequal metro area in 2022, with a 90/10 wage ratio of 5.5—up from 4.7 in 2005 when it ranked 89th, indicating that Philadelphia's wage inequality had been rising faster than the national average over the longer term. However, like most metropolitan areas, Philadelphia experienced a decline in wage inequality from 2019 to 2022 as the pandemic's unique labor market conditions compressed wage distributions. The Federal Reserve analysis suggests that wage inequality tends to be higher in larger urban areas due to agglomeration of high-skill jobs, labor market pooling, and the concentration of both high-wage tech and finance occupations alongside low-wage service jobs—dynamics clearly visible in Philadelphia's income transformation patterns.
Chicago's 16.0% mean income growth matched Philadelphia's, but its median growth of 29.8% significantly exceeded Philadelphia's, indicating that Chicago's middle-income households recovered more strongly. This pattern challenges assumptions about economic polarization—at least in the recovery phase, Chicago achieved more equitable growth.
Detroit's trajectory during 2020-2024 reveals continued vulnerability. Mean income growth of just 7.8% lagged peer cities significantly, while median income growth of 20.6% suggests that gains were concentrated in the middle rather than broadly distributed. The city's large low-income population likely faced greater pandemic-related economic disruption with slower recovery.
Pittsburgh achieved the strongest post-pandemic performance, with mean income growing 21.0% and median income rising 32.5%. This exceptional growth, particularly at the median level, suggests that Pittsburgh's economic structure—anchored by healthcare and technology—provided greater resilience and recovery capacity.
Policy Implications and Future Trajectories
The decade from 2014 to 2024 transformed urban America's economic landscape, creating winners and losers both between and within cities. Philadelphia occupies a middle position—avoiding Chicago's extreme polarization and Detroit's persistent poverty, while lacking Pittsburgh's dynamic growth. This position offers both opportunity and challenge: the chance to chart a more equitable growth path, but also the risk of falling behind in absolute prosperity.
For Philadelphia, the priority must be preventing Chicago-style polarization while maintaining economic growth. The city's relatively balanced income distribution provides a foundation, but rising inequality and persistent racial gaps demand intervention. Policies should focus on middle-income job creation, particularly in sectors accessible to Black and Hispanic workers who continue to face significant income disadvantages.
Success will be measured not by aggregate income statistics but by cities' ability to create broad-based opportunity. The persistence of racial income gaps across all four cities, regardless of their overall prosperity levels, indicates that structural barriers transcend local economic conditions. Addressing these disparities requires intentional policy intervention, not just economic growth.
As these cities enter the next decade, their trajectories will likely continue diverging. Whether this divergence deepens existing inequalities or creates models for inclusive growth depends on choices made today. The data provides a clear baseline; the challenge lies in creating policies that bend these curves toward justice.

