7. Meso Indicators: Homeownership in Philadelphia: A snapshot of trends and causes
In this Leading Indicator, we examine Philadelphia’s evolving homeownership landscape—tracking affordability trends, demographic shifts, and the mounting maintenance burdens that low-income owners face- all to understand if buying a house is a "good deal". Despite below-national average prices, home values in Philadelphia are appreciating more rapidly compared to the national average (1-year growth rate of 3.7% in Philadelphia compared to 2.1% nationally). Additionally, stark disparities by race, neighborhood, and age persist, signaling deep equity challenges. By unpacking who owns homes, the real costs of upkeep, and the uneven value growth across ZIP codes, this analysis lays the groundwork for targeted policies to bolster housing stability and close the wealth gap.
(N.B. This LI is a brief version of a more detailed report located here.)
Date: May 15th 2025
Authors: Siqi Dai, Saloni Tandon
What you need to know:
- Philadelphia Homeownership in Brief: A quick overview of key metrics highlighting affordability, sales pace, and demographic disparities.
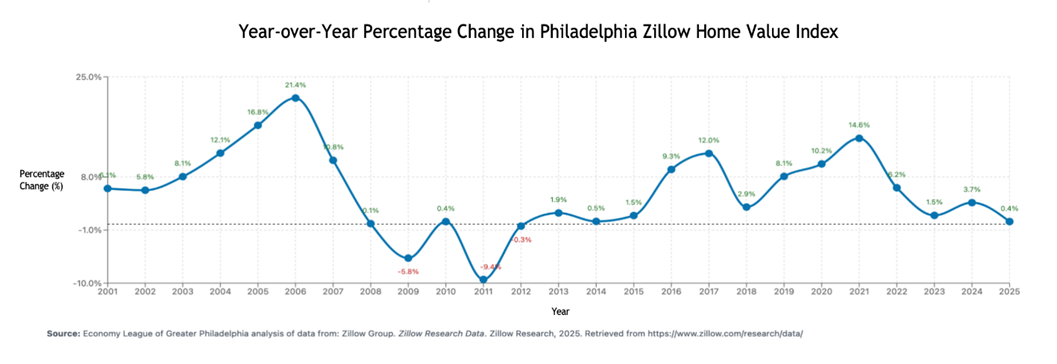
- Market Affordability: Typical home value (following Zillow’s data) was $224,533 (up 3.7% YoY) compared to the national value of $361,263 (up 2.1% YoY). Zillow’s Typical Home Value is calculated using a smoothed, seasonally adjusted estimate of home values at the 35th percentile of the housing market distribution.
- Speed of Sales: Homes under contract in ~26 days, roughly on par with national pace.
- Homeownership Rate: 56.5% for white households vs. 47.8% for Black households (2023), an enduring 8.7 ppt gap.
- Age & Buyer Profiles: Median homeowner age 35.1. First-time buyers: 75% Millennials (18–33), 19% unmarried couples. Generation X accounts for 4% of buyers (median income $126,933); Baby Boomers (59–77) hold 30% share with 16 years median tenure.
- Maintenance Burden: 40% of homes pre-1939; low-income owners spend >30% of income on housing, delay 77% of repairs.
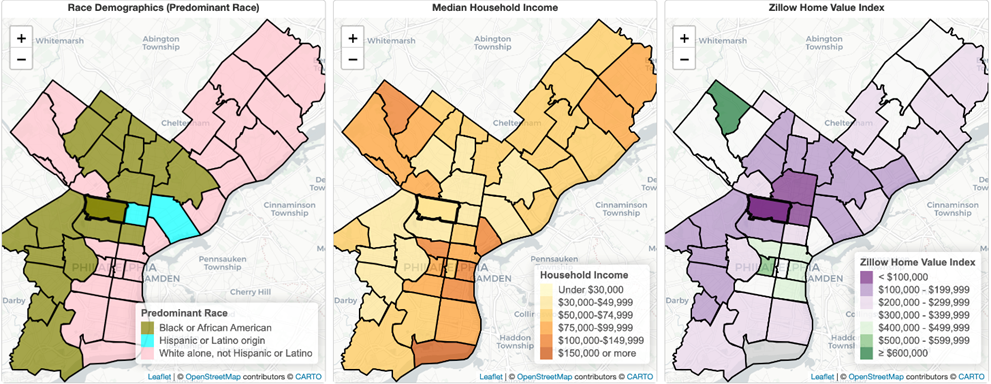
- Regional and Racial Disparities: Median home values range from about $72,000 in North Philadelphia to over $1 million in suburban Lower Merion. According to Zillow Data and Research, typical home values reflect deep disparities: in Chestnut Hill (a majority-white neighborhood), the median is $848,628, while in Fairhill (a Latino-majority neighborhood with a history of disinvestment), it's just $72,288. In Kingsessing, a majority-Black neighborhood in Southwest Philadelphia, the typical home is valued at $124,618—less than a sixth of the value in Chestnut Hill. Across Philadelphia, homes in Black-majority neighborhoods are worth 28.3% less than those in white-majority areas—amounting to $24 billion in lost equity since 1950. For Latino homeowners, this gap is even larger, totaling an estimated $33.4 billion in lost housing wealth.
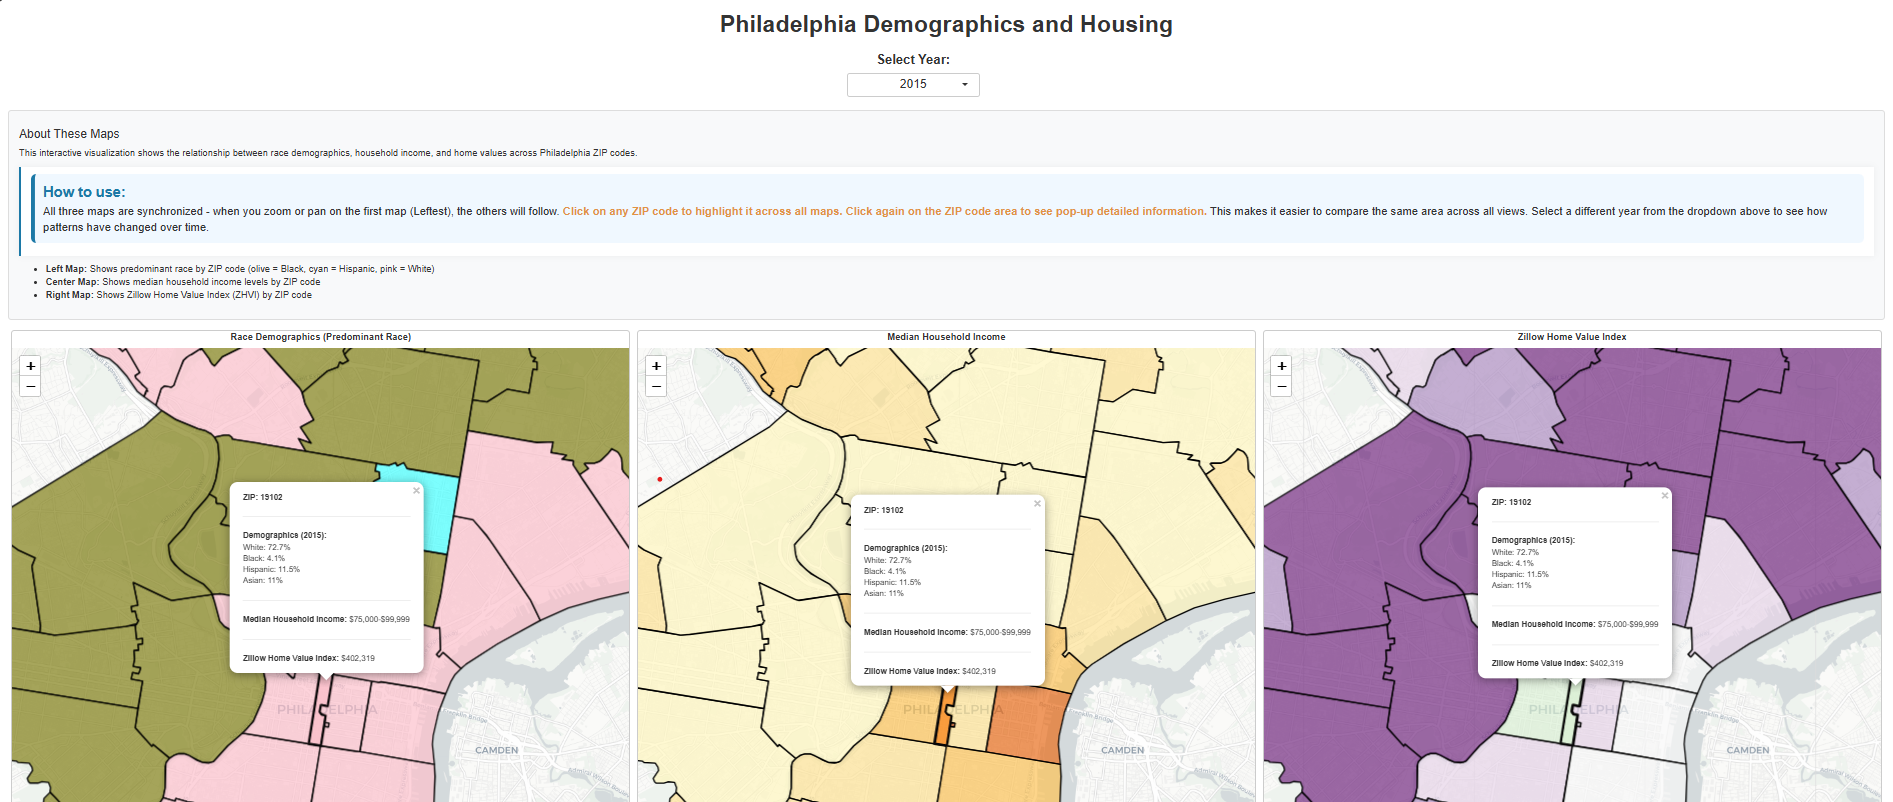
Curious to see how income, race and home values have changed across zip codes for Philadelphia since 2015?
Play with this interactive Shiny app to see clear patterns. This dashboard visualizes the relationship between race demographics, household income, and home values across Philadelphia ZIP codes. Users can explore synchronized maps to compare trends over time and across neighborhoods by selecting a year and clicking on ZIP codes for detailed insights. The data includes predominant race in the area, median household income, and Zillow’s Home Value Index (ZHVI).
Overview
Homeownership serves as a cornerstone for individual and community prosperity—offering families not only a stable place to live, but also a powerful vehicle for building wealth, fostering civic engagement, and strengthening neighborhood ties. By devoting monthly housing payments to equity rather than rent, homeowners accumulate a tangible asset that can be leveraged for education, entrepreneurship, or retirement, helping to break cycles of economic vulnerability. Owning a home also incentivizes long-term investment in property upkeep and local amenities, which in turn boosts neighborhood quality, school performance, and public safety. Moreover, the psychological benefits of ownership—rooted in a sense of belonging, control over one’s environment, and intergenerational legacy—translate into healthier, more resilient communities. In Philadelphia, where racial and geographic disparities have historically limited access to this opportunity, expanding homeownership is critical to narrowing the wealth gap and ensuring that all families share in the region’s economic growth.
To understand how these foundational benefits and challenges manifest in practice, we now turn to a closer look at Philadelphia’s housing market dynamics and valuation trends.
1. Market Dynamics & Valuation Trends
Philadelphia’s housing market has grown steadily but remains more affordable than the national average. The Zillow Home Value Index (ZHVI) shows a current typical value of $224,533, a 3.7% increase year-over-year, outpacing the U.S. growth rate of 2.1%. According to the Federal Housing Finance Agency, Philadelphia’s House Price Index reached 415.86 (Q4 2024), up 7.15% from a year ago—evidence of resilient, sustained demand despite broader economic headwinds. Homes sell in about 26 days, indicating a “somewhat competitive” market that lacks the frenzy of hotter metros.
2. Who Owns Homes? Demographics & Disparities
- Household Composition: As of 2020, 59.7% of homeowners lived in family households (32.1% married couples) and 40.3% in non-family arrangements, including 33.8% living alone.
- Multigenerational Trends: In 2024, 14% of buyers purchased to accommodate aging parents or adult children.
- Single Women Leading: 51.3% of single women own homes in the Philadelphia metro (vs. 47.5% of single men), though female homeowners skew older (median age 67 vs. 57 for men).
- Recent Purchases: Married couples comprise 59% of 2024 buyers; single women account for 19%, underscoring their growing market influence.
- Millennials (18–33): 75% of first-time buyers; many unmarried (19% as couples).
- Generation X (44–58): Only 4% of buyers but with the second-highest median buyer income at $126,933.
- Baby Boomers (59–77): Hold 30% of homes, averaging 16 years of ownership.
- Racial Homeownership Gap: In 2023, white households in Philadelphia had a homeownership rate of 56.54%, compared to 47.84% for Black households—a gap of 8.7 percentage points, down from 11.4 points in 2012. While this decline suggests progress, it is largely due to a drop in white homeownership (from 59.23%), not gains among Black households, whose rate has held steady (47.86% in 2012 to 47.84% in 2023—a statistically insignificant change). Though the gap is narrowing, it remains a stubborn marker of systemic inequality.
3. Costs & Benefits of Ownership
- Housing Quality & Maintenance: At a national level, as per the U.S Census data, nearly 40% of homes built before 1939 demand costly upkeep. The thumb rule—1% of home value per year—equates to $3,000 for a $300,000 property. For Philadelphia in specific, as of 2022, ~41% of the housing units were constructed before 1940. In 2024, the average annual home maintenance cost in 2023 was reported to be $2,458, with emergency repairs adding an additional $1,667.
- Affordability Strain: Among households earning less than $35,000, 89–100% spend more than 30% of income on housing. Loan denial rates exacerbate inequities: 41% of Black applicants vs. 29% of white are turned down for home-improvement financing.
- Deferred Repairs: 77% of low- to moderate-income owners delay essential fixes. Urgent repairs can cost $500–$15,000; major upgrades range $4,800–$12,400, often unaffordable for many.
- Infrastructure Gaps: As of 2023, 0.4% of households lack complete plumbing, 0.6% lack full kitchen facilities, and 1.2% have no telephone service—symptoms of deferred maintenance and concentrated poverty.
4. Uneven Appreciation & Structural Drivers
- Geographic Segmentation: Affluent Suburban Enclaves: Gladwyne ($1.39 M), Villanova ($1.3 M), Haverford (~$1 M). Huge disparities within the city: Median home values in North Philadelphia (19132) are $75,889, while those in Chestnut Hill (19118), barely a mile away, are $690,229.
- Equity Impacts: In Philadelphia city, homes in majority-Black neighborhoods have appreciated at significantly lower rates than those in majority-white areas, resulting in an estimated $24 billion in lost housing wealth since 1950.
- Access to Finance: Black applicants are 2.8 times more likely to be denied mortgages than white applicants. Denial reasons disproportionately cite credit history (29% for Black vs. 16% for white applicants).
- Historical Redlining Legacy: Federal housing maps from the 1930s still correlate with today’s patterns of disinvestment. In historically Black neighborhoods like Mill Creek and Haddington—majority-Black in both 1950 and 2021—home values rose only modestly between 2000 and 2021, from $3,014 to $6,907 (129.2%) and from $4,558 to $7,815 (71.5%), respectively. In contrast, majority-white neighborhoods like Center City East and Northern Liberties saw dramatic increases, with home values rising from $17,101 to $77,517 (353.3%) and from $12,547 to $45,710 (264.3%).
Policy Levers & the Path Forward
While the city remains more affordable than many major U.S. metros, rising values and uneven appreciation patterns disproportionately benefit already-wealthy neighborhoods, reinforcing long-standing racial and economic divides. For some Philadelphians—particularly those in higher-income, appreciating areas—homeownership continues to be a good deal, offering a pathway to generational wealth and financial security. But for many others, especially Black and low-income residents, systemic barriers such as appraisal bias, discriminatory lending, housing cost burdens, and underinvestment make homeownership far less accessible or beneficial.
Bridging these gaps will require coordinated efforts—through inclusive policy, investment in historically disinvested communities, and reforms to make homeownership truly accessible for all. Some policies currently available include:
- $100K Homestead Exemption: Offers significant property tax relief for homeowners with a primary residence, exempting the first $100,000 of a property's value from taxes.
- LOOP (Longtime Owner Occupants Program): Helps long-term homeowners in gentrifying neighborhoods avoid property tax increases by freezing their assessed value.
- OOPA (Owner-Occupied Payment Agreement): Assists homeowners with delinquent taxes by offering affordable payment plans, preventing foreclosure.
- BSRP (Basic Systems Repair Program): Provides free emergency repairs for essential home systems, including plumbing, electrical, heating, and structural repairs.
- Philly First Home: Offers grants up to $10,000 (or 6% of the home's purchase price) for first-time homebuyers.
- Restore, Repair, Renew (RRR): A loan program for low-interest loans to homeowners in "middle neighborhoods."

